
Figure 2.
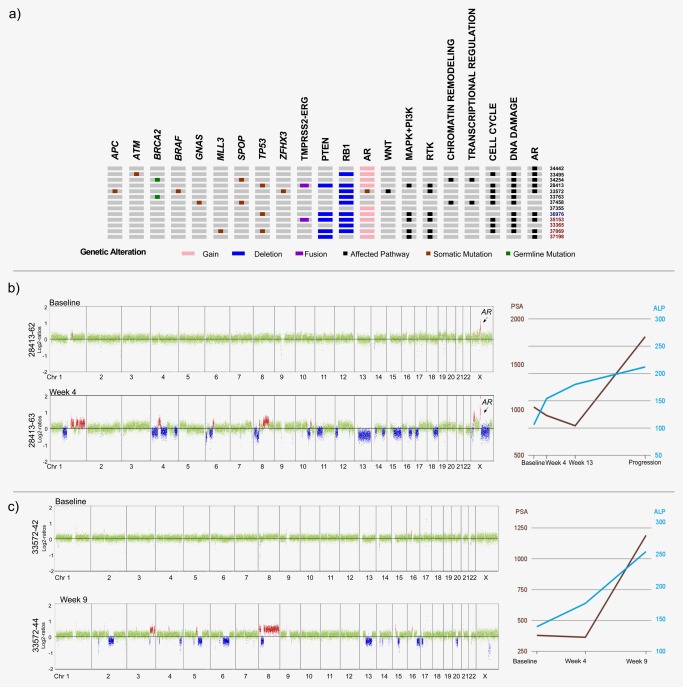
Panel sequencing and pathway analyses. (a) Overview of somatic mutations (the pathogenic germline BRCA2 mutations were included, as they likely have a significant impact on the prostate cancer genome) as well as some SCNAs, i.e. deletions of the PTEN [10q23.31] and RB1 [13q14.2] loci, AR amplification and the TMPRSS2‐ERG rearrangement and pathways affected by these alterations. The oncoprint summarizes the 15 patients for which significant SCNAs and/or coding variants were detected. The eight columns (with the black symbols) to the right depict affected pathways (black and red numbers: patients treated with abiraterone and enzalutamide, respectively; blue number: patient treated sequentially with abiraterone followed by enzalutamide). (b) Plasma‐Seq profiles derived from patient #33572, whose tumor genome harbored two somatic mutations, i.e. L702H and T878A, in the AR gene (the x‐axis shows the chromosomes, the y‐axis indicates log2 copy number ratios; green: balanced regions; red: gained regions; blue: lost regions). While the baseline profile (33572‐42) was balanced, after 2 months with abiraterone treatment the progression profile (33572‐44) showed multiple SCNAs indicating increasing ctDNA, which was accompanied by raising ALP and PSA levels. The line graph displays PSA (brown) and ALP (blue) values obtained at the same time as the plasma sample (x‐axis: time points). (These color schemes for copy number profiles and ALP/PSA displays apply to all subsequent figures.) (c) Patient #28413 had a high‐amplitude AR amplification already at baseline. An increase in ctDNA was noted in the second plasma sample (28413‐63) with multiple SCNAs including the AR amplicon and PTEN loss at 10q23.31 (Log2‐ratio −0.98). [Color figure can be viewed at http://wileyonlinelibrary.com]