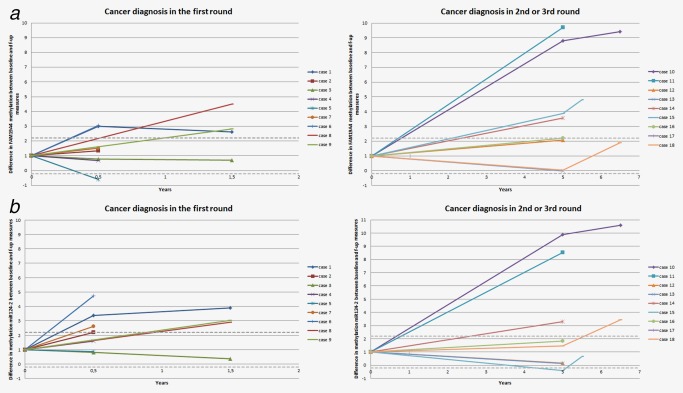
Figure 2.

FAM19A4 (a) and mir124‐2 (b) methylation levels over time. Relative difference in FAM19A4 (a) and mir124‐2 (b) methylation levels between baseline and follow‐up cervical scrapes of women with cancer diagnosed in the first screening round (left panel), or in the second or third screening round (right panel). Baseline methylation levels are set to 1, and the difference over baseline level at the different time points is plotted. The grey dotted lines represent 2xSD (upper) or −2xSD (lower) of a repeat analysis. Samples within these lines are considered to have similar methylation level as compared to baseline. SD = standard deviation. [Color figure can be viewed at http://wileyonlinelibrary.com]
