
Figure 5.
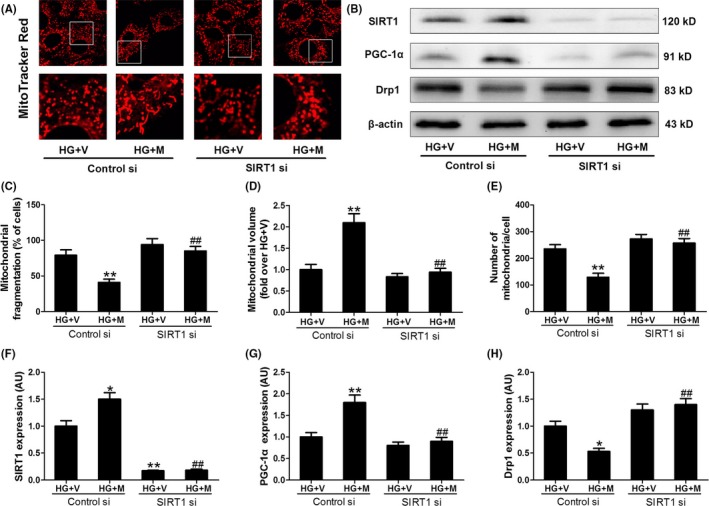
SIRT1 siRNA blunted the effect of melatonin on PGC‐1α, Drp1 and mitochondrial fission in hyperglycemia‐treated H9c2 cells. (A) Representative confocal microscope images showing mitochondrial morphology stained by MitoTracker Red (major finding is C‐E). Original magnification ×600. (B,F‐H) Protein expressions of SIRT1, PGC‐1α, and Drp1 were determined by Western blotting. (C) The percentage of cells with fragmented mitochondria. (D) Mean volume of mitochondria (fold over HG+V). (E) The number of mitochondria per cell. Presented values are means ± SEM. HG, high glucose (33 mmol/L glucose); V, vehicle; Mel, melatonin. n = 6 in each group. *P < .05, **P < .01 vs HG+V with Control si. ## P < .01 vs HG+M with Control si