Figure 2.

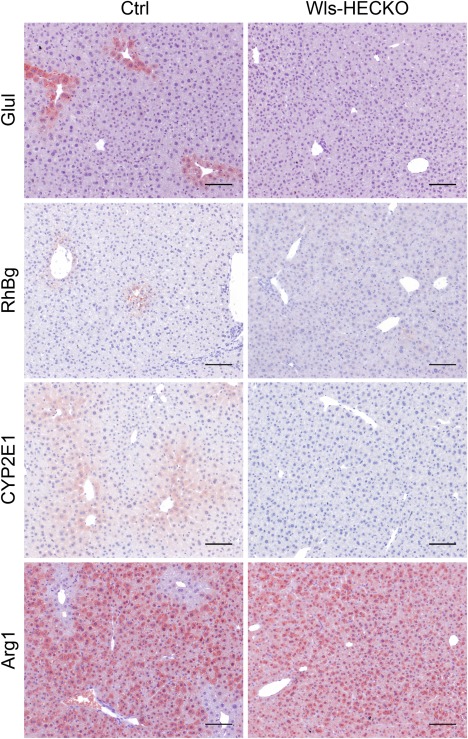
Disturbed metabolic zonation in Wls‐HECKO livers. Immunohistochemistry (10× objective) shows Glul, RhBg, Arg1, and CYP2E1 staining pattern in Ctrl pericentral HCs (left) in comparison to Wls‐HECKO (right). Scale bar = 100 μm; n = 7.

Disturbed metabolic zonation in Wls‐HECKO livers. Immunohistochemistry (10× objective) shows Glul, RhBg, Arg1, and CYP2E1 staining pattern in Ctrl pericentral HCs (left) in comparison to Wls‐HECKO (right). Scale bar = 100 μm; n = 7.