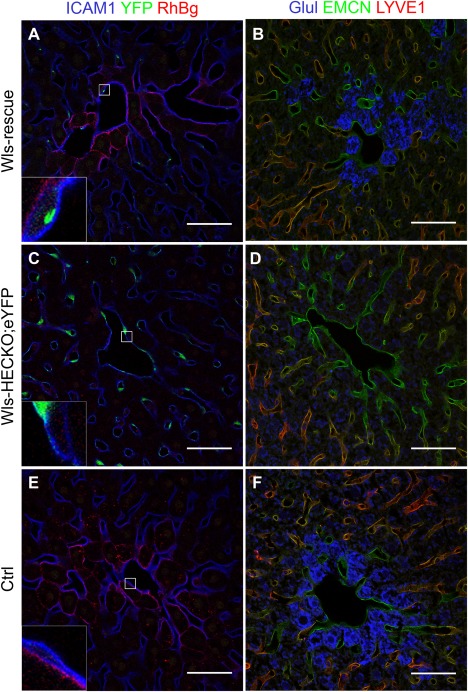
Figure 7.

RosaEvi‐YFP expression in Wls‐rescue livers. Representative pictures of immunofluorescence (63× objective) showing focal YFP (green) staining in HECs of Wls‐rescue livers (A, n = 2), strong YFP staining in HECs of Wls‐HECKO;eYFP (C, n = 5), and no YFP signal in Ctrl liver (E, n = 5). Ctrl (n = 5) and Wls‐rescue (n = 2) livers show a pericentral, membranous RhBg staining pattern in HCs (A,E), which is absent in pericentral HCs in Wls‐HECKO;eYFP (C). EMCN (green) staining is positive in CVECs and pericentral LSECs, whereas LYVE1 (red) is highly positive in midlobular LSECs of all groups (B,D,F). Glul (blue) is expressed in HCs adjacent to CVECs expressing EMCN in Wls‐rescue (B) and Ctrl (F). Wls‐HECKO;eYFP shows no signal for Glul. (F). Scale bar = 50 μm.
