
Figure 1.
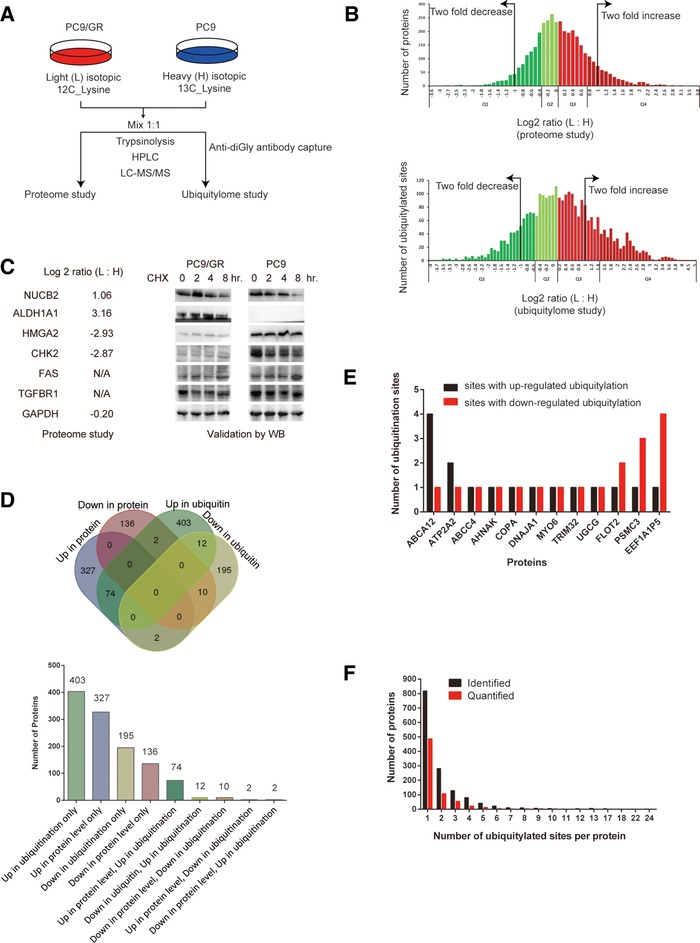
Characterization of protein ubiquitylome in gefitinib‐resistant NSCLC cells. A) Proteome and ubiquitylome project workflow. PC9/GR cells were labeled with light (L) isotopic 12C lysine, and PC9 cells were labeled with heavy (H) isotopic 13C lysine. B) Quantiles‐based clustering of quantified proteins in the proteome study (upper panel) or quantified ubiquitylated lysine sites in the ubiquitylome study (lower panel), in PC9/GR versus PC9 cells. The quantified proteins or ubiquitylated lysine sites were divided into four quantiles according to the log2 ratio (L: H): Q1 (0–25%; dark green), Q2 (25–50%; light green), Q3 (50–75%; light red), and Q4 (75–100%; dark red). C) Comparison of protein expression in PC9/GR versus PC9 cells using two different methods. Log2 ratio (L:H) of indicated proteins from the proteome study (left panel). N/A stands for the data not available in the proteome study. Western blotting (WB) validation of differentially expressed proteins in PC9/GR and PC9 cells (right panel). GAPDH serves as a loading control in WB. D) Venn diagram showing the overlapping groups of proteins among up‐ or downregulated proteins and proteins with up‐ or downregulated ubiquitylated lysine sites in PC9/GR cells versus PC9 cells. The bar graph shows the number of proteins in each overlapping group of proteins. E) Bar graph showing 12 proteins containing both up‐ and downregulated ubiquitylation sites within the same protein. F) Distribution of the number of ubiquitylated lysine sites per protein in PC9/GR versus PC9 cells. The black or red bar indicates proteins either identified or quantified in the ubiquitylome study.