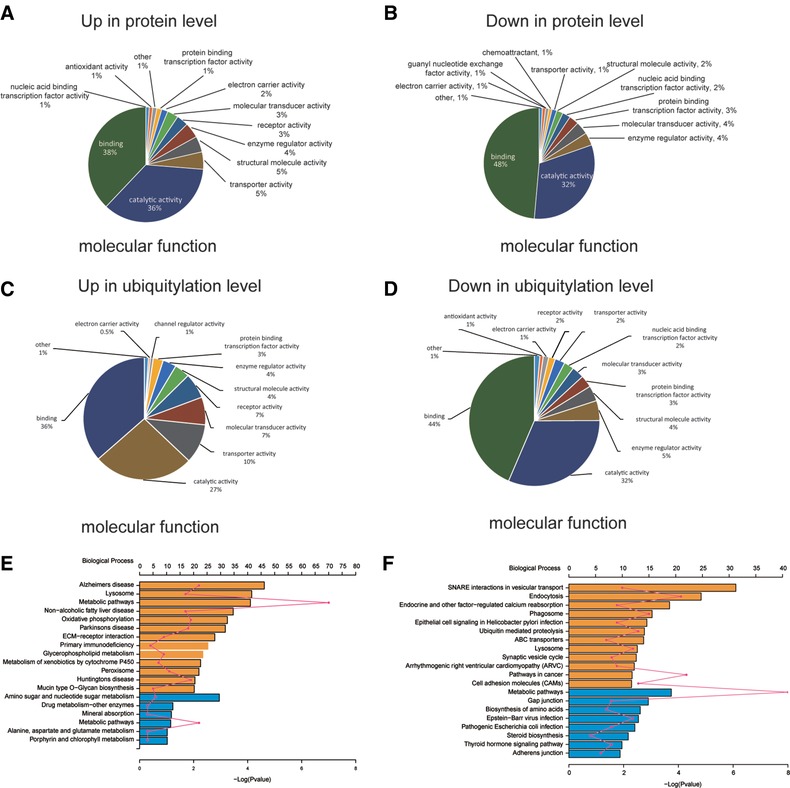
Figure 3.

Classification of molecular functions and pathway enrichment analysis for differentially expressed proteins or proteins with lysine sites undergoing differential regulation in ubiquitylation in PC9/GR versus PC9 cells. Molecular functions for (A) upregulated or (B) downregulated proteins in PC9/GR versus PC9 cells. Molecular functions for proteins containing lysine sites undergoing (C) upregulated or (D) downregulated ubiquitylation in PC9/GR versus PC9 cells. Pathway enrichment analysis for (E) differentially expressed proteins or (F) proteins with differentially regulated ubiquitylation in PC9/GR versus PC9 cells. The top x axis represents the number of proteins enriched in the pathway, the bottom x axis represents – log (p value), and the y axis represents the name of KEGG pathway.
