
Figure 4.
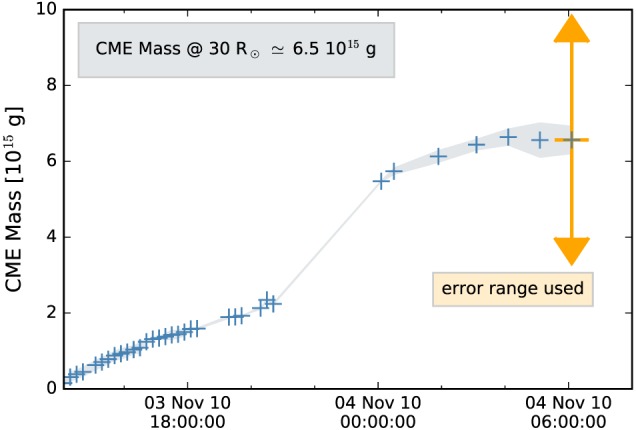
CME mass evolution versus time derived from Large Angle and Spectrometric Coronagraph C3 white light imagery covering the distance range ∼5–30 R⊙. The final mass is derived as average over the last three data points, between 4 and 6 UT on 4 November 2010. The orange error bar marks the POS mass range, which is further used in this study. CME = coronal mass ejection.