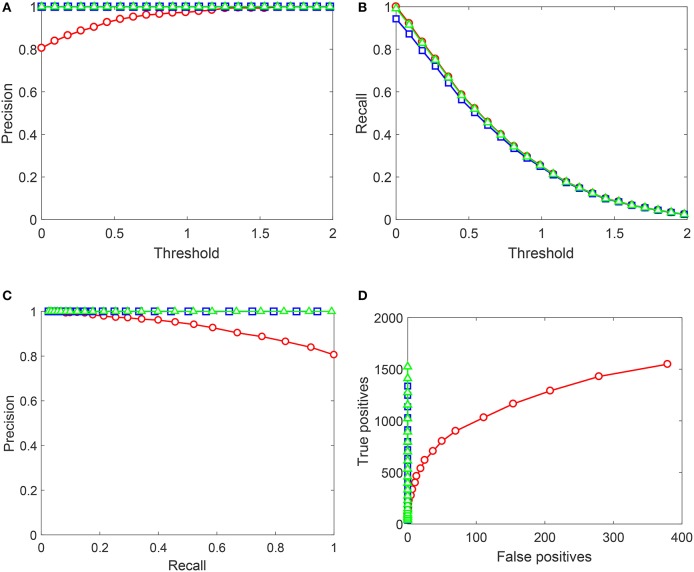
Figure 8.
Performance of the up-trained AIs on Testing set 1 (Set 1). Red circles correspond to the original AIs without Knowledge Transfer Units. Blue squares correspond to AIs after Algorithm 1, and green triangles illustrate application of Algorithm 2. (A) Shows Precision (averaged over 10 realizations of Set 1) as a function of the decision threshold in AIs, (B) shows Recall (averaged over 10 realizations of Set 1), (C) contains the corresponding Precision-Recall data, and (D) shows True positives vs. False positives for a single realization of Set 1. Lines between points are shown for the sake of visualization and do not represent any measurements or indicate achievable performance.

