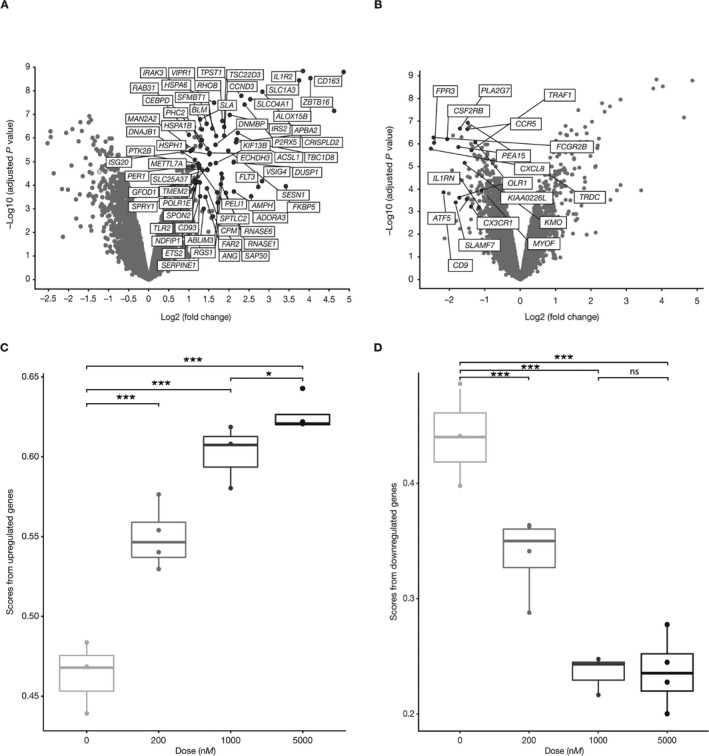
Figure 1.

Identification of glucocorticoid (GC)–regulated genes. Peripheral blood mononuclear cells from normal healthy volunteers were cultured in vitro for 6 hours with either 1 μM prednisolone or DMSO vehicle alone. RNA was analyzed for gene expression using Affymetrix profiling. Analyses of genes modulated by prednisolone compared with vehicle are shown. Axes represent the false discovery rate (FDR)–adjusted log10‐transformed P value versus fold change. A and B, Genes up‐regulated (A) and down‐regulated (B) >2‐fold by prednisolone versus vehicle with an FDR‐adjusted P value of ≤0.05. C and D, Single‐sample gene set enrichment analysis scores for genes up‐regulated (C) and down‐regulated (D) in whole blood samples stimulated with increasing concentrations of prednisolone in vitro. Data in C and D are presented as box plots, where the boxes represent the 25th to 75th percentiles, the lines within the boxes represent the median, and the lines outside the boxes extend to the minimum or maximum values after excluding outliers. * = P = 0.027; *** = P < 0.001. NS = not significant.
