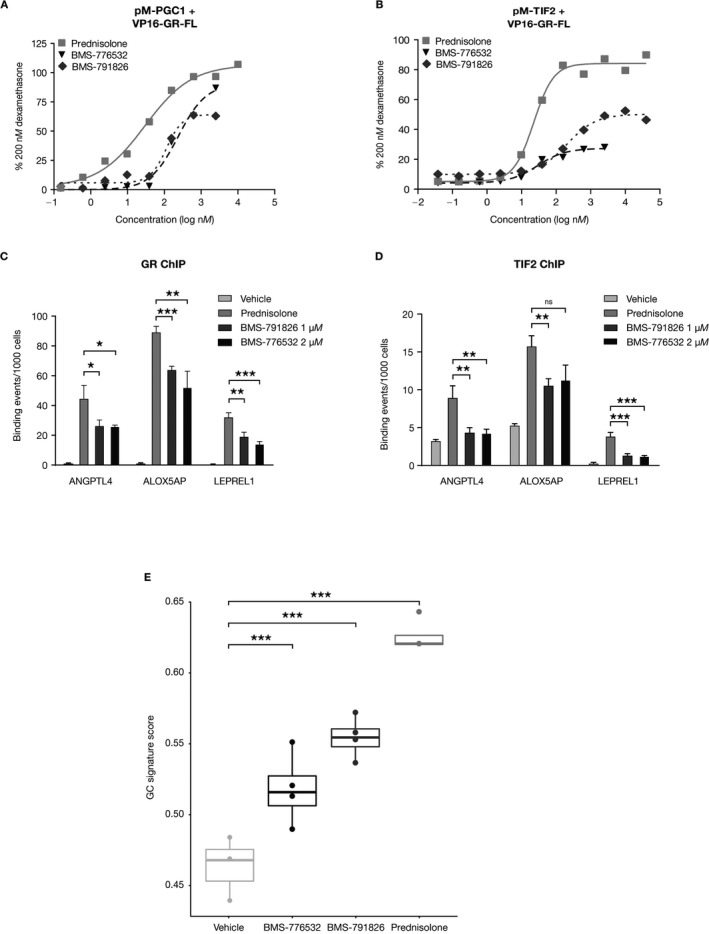
Figure 2.

Validation of the glucocorticoid (GC) gene signature using partial GC receptor (GR) agonists. A and B, Mammalian 2‐hybrid analysis of peroxisome proliferator–activated receptor γ coactivator 1 (PGC1) (A) and transcription intermediary factor 2 (TIF‐2) (B) recruitment by prednisolone, BMS‐776532, and BMS‐791826. Values are the means of triplicate wells, normalized to the activity induced by 200 nM dexamethasone. Results are from a representative experiment of 2 independent experiments performed. C and D, Analysis of GR (C) and TIF‐2 (D) recruitment to the promoters of ANGPTL4,ALOX5AP, and LEPREL1 by 1 μM prednisolone, 1 μM BMS‐791826, and 2 μM BMS‐776532, as analyzed by chromatin immunoprecipitation (ChIP) assay followed by quantitative polymerase chain reaction analysis. Values are the mean ± SD of triplicate reactions. Binding values are normalized to input values. E, GC gene signature scores for whole blood samples cultured in vitro with either DMSO vehicle, 5 μM prednisolone, 5 μM BMS‐776532, or 10 μM BMS‐791826. Data are presented as box plots, where the boxes represent the 25th to 75th percentiles, the lines within the boxes represent the median, and the lines outside the boxes extend to the minimum or maximum values after excluding outliers. * = P < 0.05; ** = P < 0.01; *** = P < 0.001 versus prednisolone, by Student's t‐test. FL = full‐length; NS = not significant.
