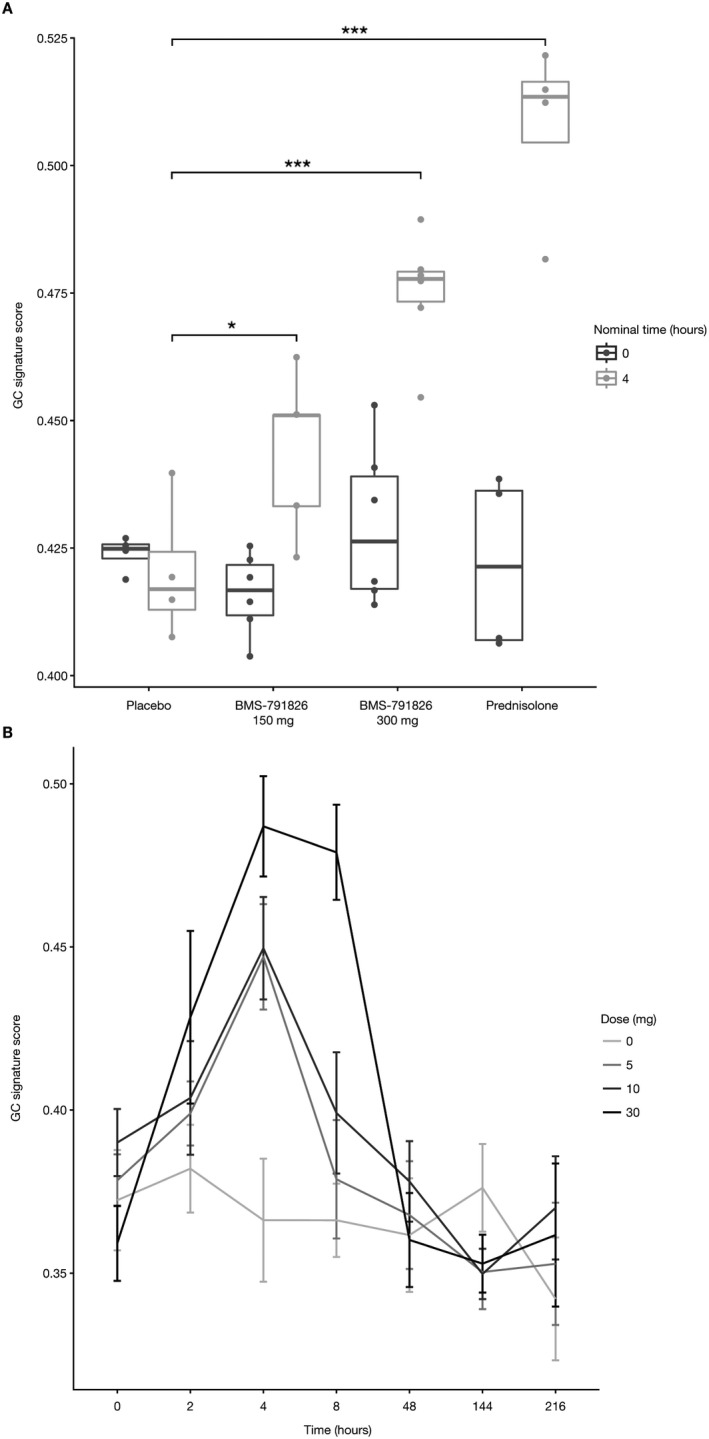
Figure 3.

In vivo validation of the GC gene signature. A, Normal healthy volunteers (NHVs) were administered an oral dose of 150 mg or 300 mg BMS‐791826, 10 mg prednisolone, or placebo. Blood samples were collected before administration and 4 hours postdose. Whole blood expression profiles were analyzed for the GC gene signature. Data are presented as box plots, where the boxes represent the 25th to 75th percentiles, the lines within the boxes represent the median, and the lines outside the boxes extend to the minimum or maximum values after excluding outliers. B, NHVs were administered 5 mg, 10 mg, or 30 mg prednisolone or placebo (i.e., 0 mg). Blood was drawn before administration and at different time points postdose (2, 4, 8, 48, 144, and 216 hours). Whole blood expression profiles were analyzed for the GC gene signature. Bars show the mean ± SEM. * = P = 0.027; *** = P < 0.001. See Figure 1 for definitions.
