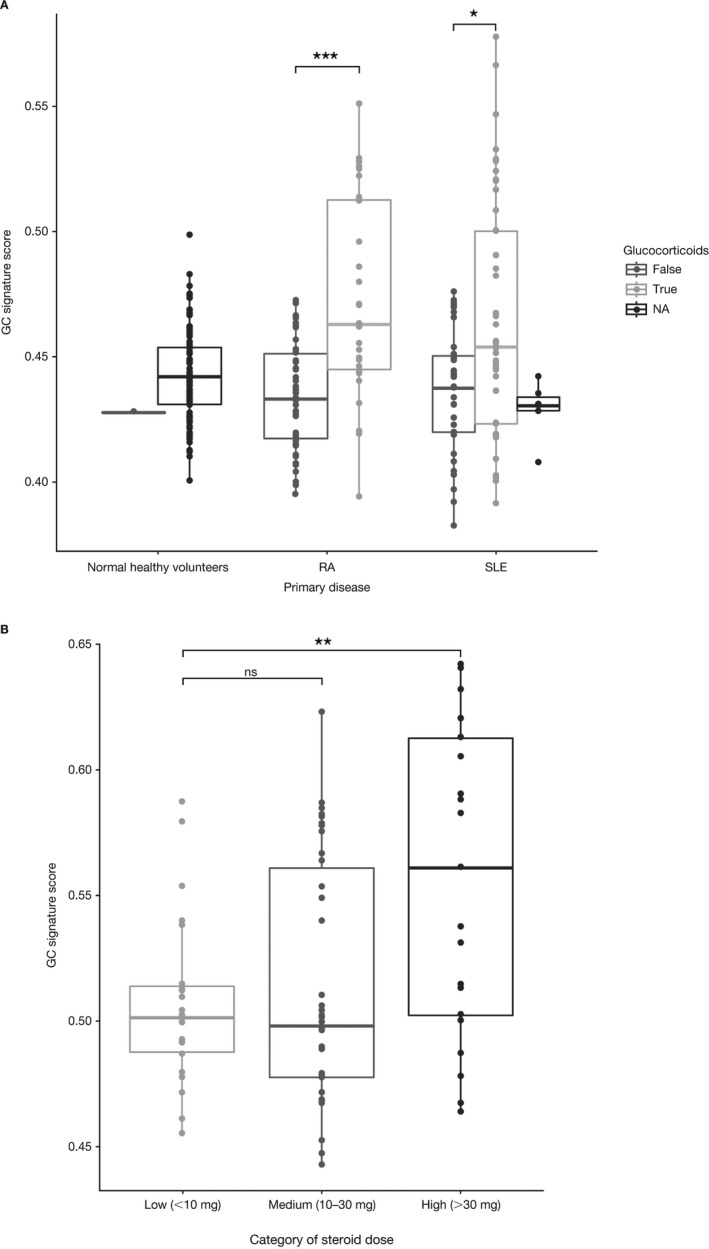
Figure 4.

Relationship between the GC gene signature and GC use in the rheumatoid arthritis (RA) and systemic lupus erythematosus (SLE) cohorts. A, GC gene signature expression in cross‐sectional cohorts of patients with RA or SLE. Whole blood was collected from normal healthy volunteers, patients with RA, and patients with SLE. RNA was isolated and used to probe Affymetrix HG‐219 arrays. GC gene signature scores are categorized as patients currently receiving GCs (true) versus patients receiving other standard‐of‐care treatments (false). Patients without treatment information are indicated as not available (NA). B, GC gene signature scores for baseline samples from the IM101‐042 abatacept SLE phase II trial, according to GC dose (low, medium, or high). Data are presented as box plots, where the boxes represent the 25th to 75th percentiles, the lines within the boxes represent the median, and the lines outside the boxes extend to the minimum or maximum values after excluding outliers. * = P = 0.01; ** = P = 0.001; *** = P < 0.001. See Figure 1 for other definitions.
