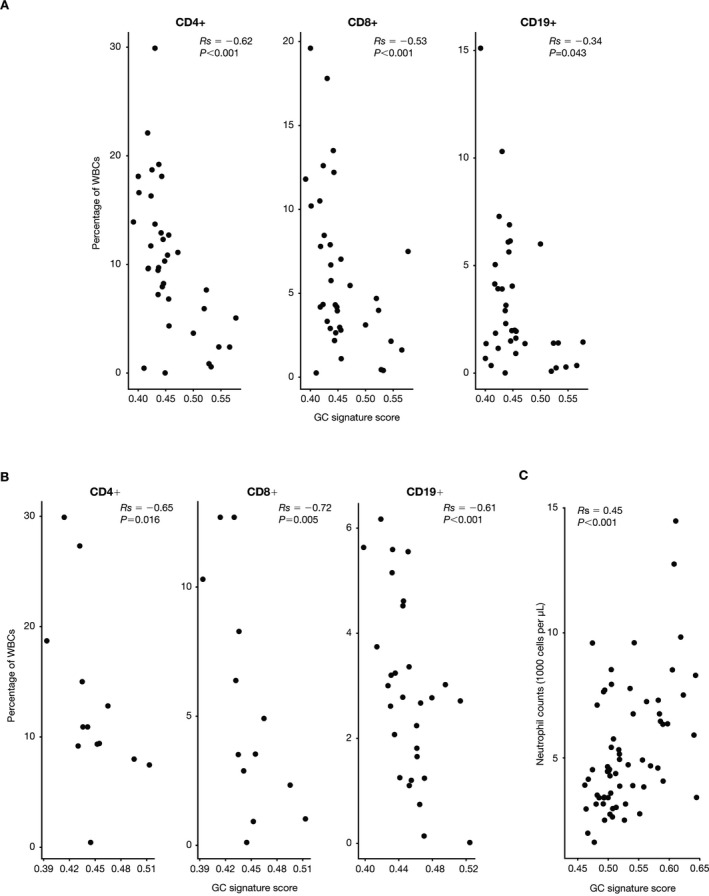
Figure 5.

Glucocorticoid (GC) gene signature correlations with T and B cell subsets. A and B, Percentages of peripheral blood CD4+ T cells, CD8+ T cells, and CD19+ B cells from patients with systemic lupus erythematosus (SLE) (A) and patients with rheumatoid arthritis (B), plotted relative to the GC gene signature score for each patient. C, Peripheral blood neutrophil counts from the IM101‐042 abatacept SLE study baseline samples, plotted relative to the GC gene signature score for each patient. Correlations were analyzed using Spearman's rank correlation coefficients. Each data point represents an individual patient. WBCs = white blood cells.
