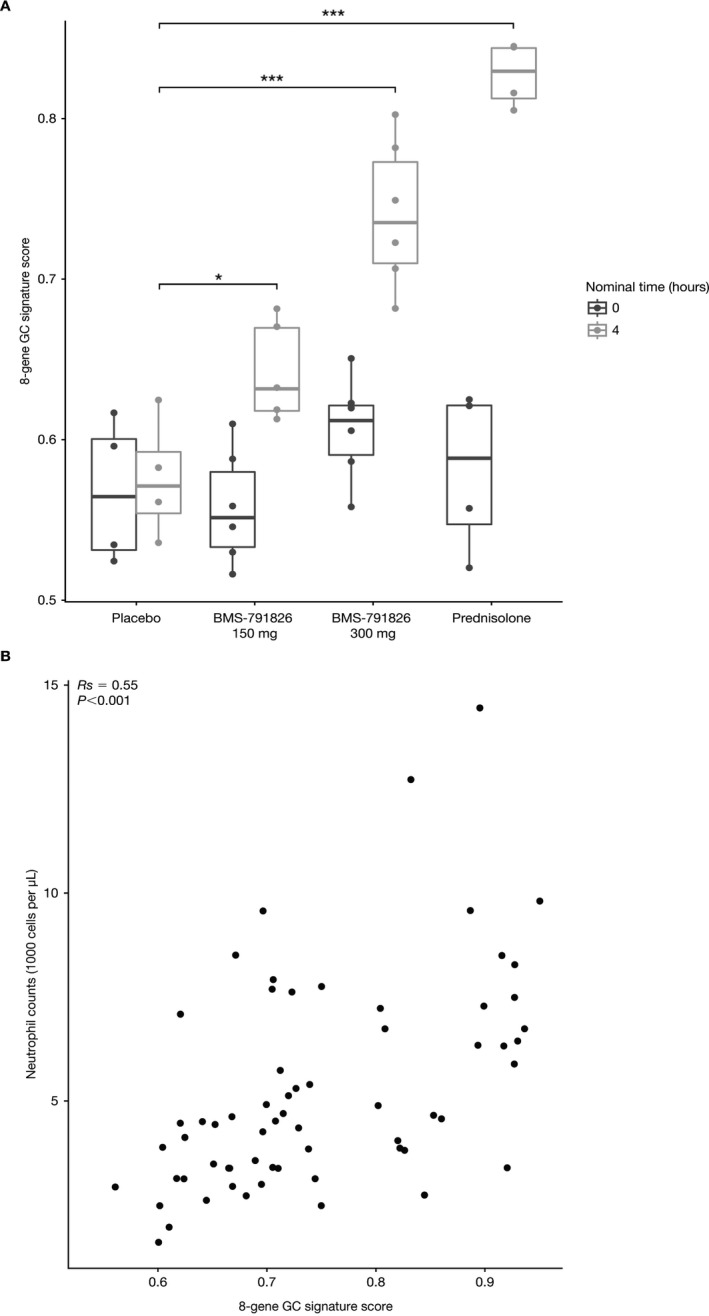
Figure 6.

Validation of the 8‐gene glucocorticoid (GC) signature. A, GC gene signature scores using an abbreviated list of 8 genes for participants from the IM125‐001 study who received placebo, 150 or 300 mg BMS‐791826, or 10 mg prednisolone. Data are presented as box plots, where the boxes represent the 25th to 75th percentiles, the lines within the boxes represent the median, and the lines outside the boxes extend to the minimum or maximum values after excluding outliers. B, GC gene signature scores using the 8‐gene list versus peripheral blood neutrophil counts for participants from the IM101‐042 abatacept systemic lupus erythematosus study. Correlations were calculated using Spearman's rank correlation coefficients. Each data point represents an individual patient. * = P = 0.015; *** = P < 0.001.
