Figure 1.

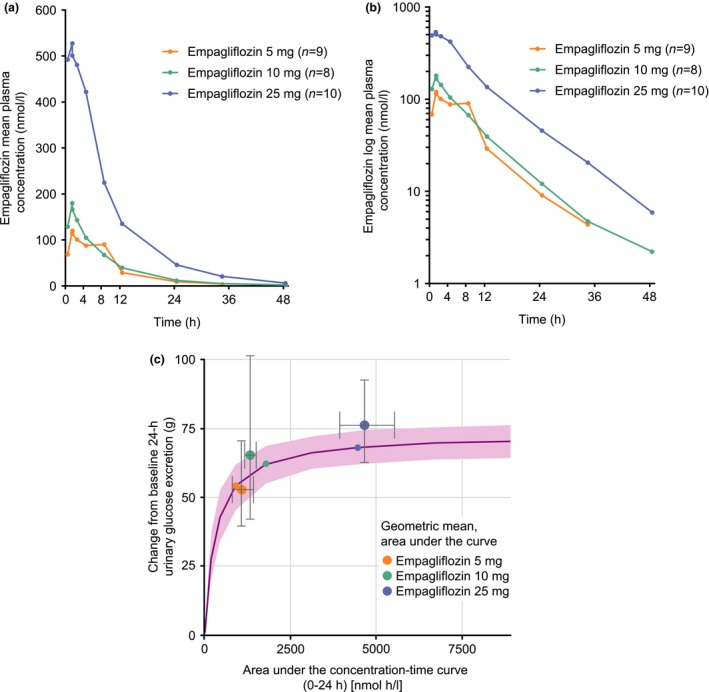
Arithmetic mean concentration–time profiles of empagliflozin in plasma, (a) linear scale and (b) log scale, and (c) simulated exposure–response profile. (a and b) The mean empagliflozin plasma concentration for the 5‐mg dose group at 48 h post dose was not calculated as only three individual values were available at this time point. As predefined, descriptive statistics of concentrations at specific time points were calculated only if at least two‐thirds of the participants had concentrations within the validated concentration range. (c) Pink line: median of simulations, pink shaded area: 95% CI of simulated median. Small circles: change from baseline in 24‐h urinary glucose excretion for an adult participant at the median 24‐h area under the concentration–time curve in the respective dose group of the simulations [typical adult person: 58‐year‐old male with Type 2 diabetes; baseline mean daily glucose: 6.9 mmol/l (adjusted to typical value for paediatric patient)]. Large circles: geometric mean (gMean) change from baseline in 24‐h urinary glucose excretion for paediatric participant at the gMean 24‐h area under the curve in the respective dose group. Error bars: 95% CI of the gMeans in each dose group in paediatric participants, calculated as gMean ± 1.96×se.
