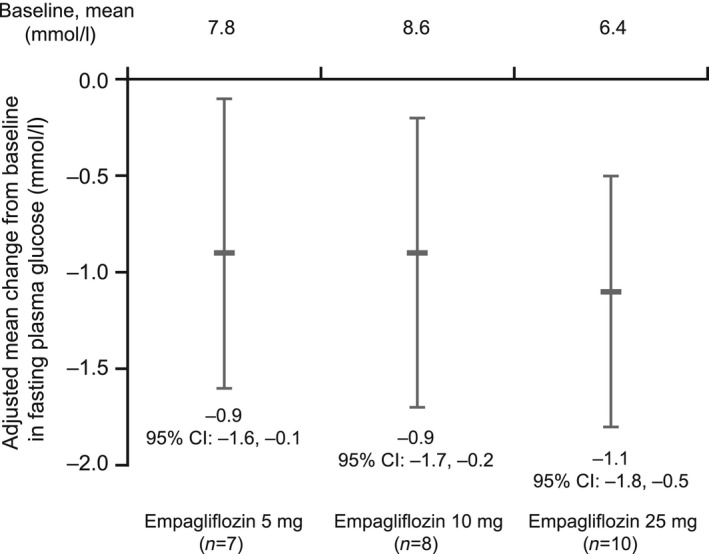
Figure 3.

Mean changes from baseline in fasting plasma glucose (including 95% confidence intervals) after 24 h (adjusted for baseline fasting plasma glucose). Analysis includes only patients with both a baseline and on‐treatment fasting plasma glucose value.
