Figure 5.

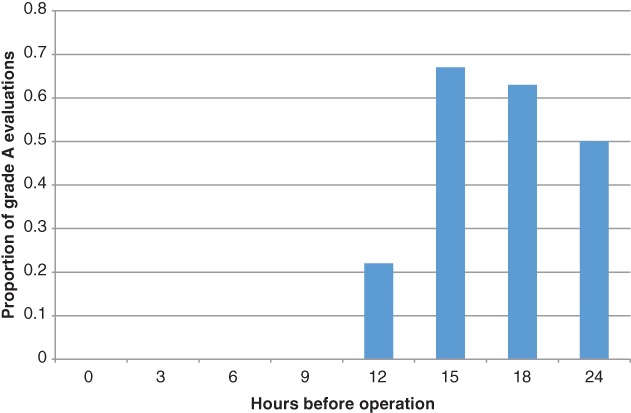
The proportion of cases in which two or more evaluators classified the visibility of the gallbladder and bile ducts as grade A first increased with the 12‐h group, reached a peak in the 15‐h group, and decreased thereafter.

The proportion of cases in which two or more evaluators classified the visibility of the gallbladder and bile ducts as grade A first increased with the 12‐h group, reached a peak in the 15‐h group, and decreased thereafter.