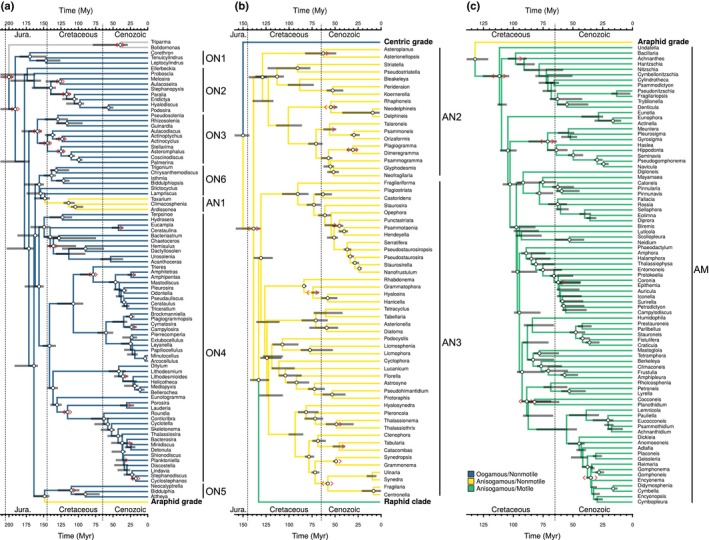
Figure 1.

Time‐calibrated phylogeny of diatoms based on 11 genes with 1151 diatoms and six Parmales pruned down to one taxon per genus (N = 234). The highest scoring tree, based on 100 maximum likelihood optimizations, is shown. In (a–c), branches are colored according to life history and motility. White circles at nodes indicate UltraFast bootstrap support ≥95%. Gray bars denote the 5% and 95% quantiles of the distribution of node ages across bootstrap replicates in millions of years (Myr). Red angular brackets denote calibrations, single ‘>’ for a minimum bound only and double ‘< >' for minimum and maximum bounds. Clade labels for oogamous nonmotile (ON), anisogamous nonmotile (AN) and anisogamous motile (AM) lineages match the groups in Figs 2(c) and 3(b–d).
