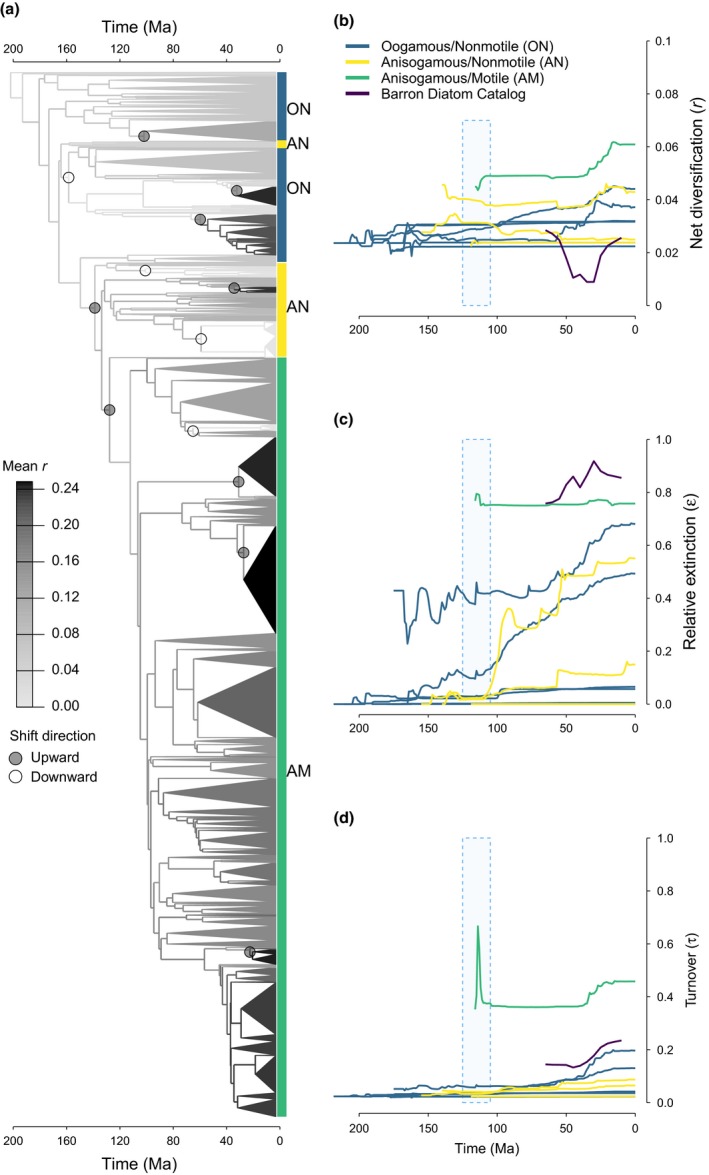
Figure 4.

Discrete shifts and temporal trends of diversification across diatoms. (a) Medusa reconstruction of rates of (birth − death, r = b − d, events per million years) across the genus‐level phylogeny of diatoms + Parmales. Triangle size is proportional to the number of species per genus (from DiatomBase), and the shading corresponds to the estimated net diversification rate. Rate shifts detected in ≥50% of trees are shown. (b–d) Temporal trends in net diversification, relative extinction (ε = d/b) and turnover (τ = b + d) as estimated by the genus‐level Medusa analysis. Trend lines were calculated by slicing the bootstrap phylogenies into 1 million yr (Myr) intervals and averaging the branch‐associated parameters for each slice across trees. Trendlines are shown for the most inclusive clades with a combination of reproductive and locomotory traits, and match the groups in Fig. 2(c) and the clade labels in Fig. 1. Rates estimated from the Cenozoic marine fossil record (bin size, 5 Myr) were smoothed using nonparametric local polynomial regression (LOESS), but are otherwise not different from Fig. 2(a). The timing of the evolution of active motility (the range of crown age estimates for raphid pennates across bootstrap phylogenies) is shown as a blue rectangle. See Supporting Information Fig. S5 for an identical analysis with AlgaeBase instead of DiatomBase species richness. Ma, million years ago.
