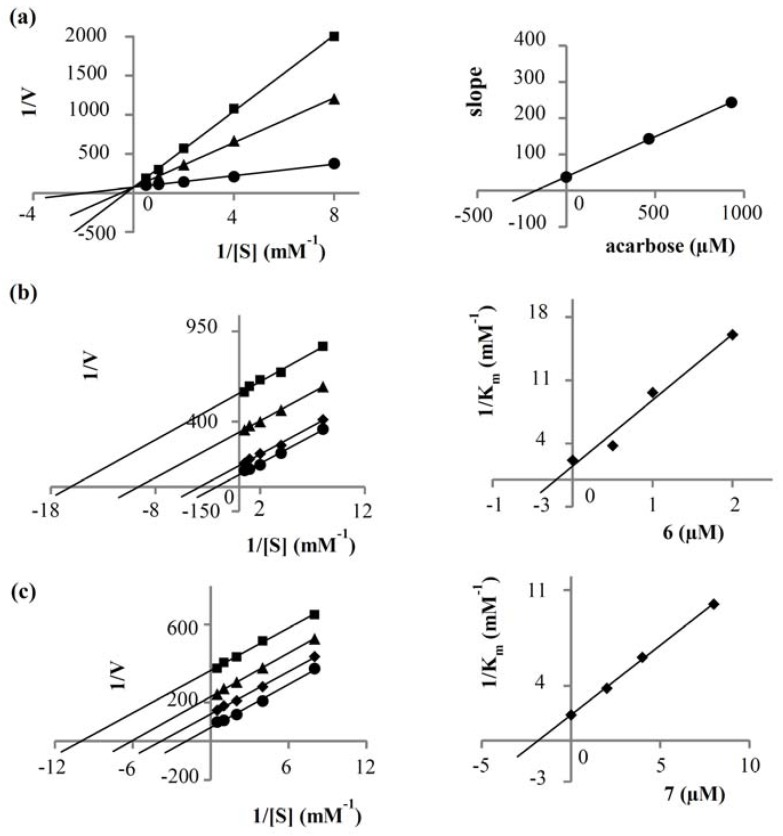
Figure 2.
Lineweaver-Burk plots of (a) acarbose: ● control, ■ acarbose 600 µg/mL, ▲ acarbose 300 µg/mL; (b) N-trans-coumaroyltyramine (6): ● control, ■ (6) 2 µM, ▲ (6) 1 µM, ◆ (6) 0.5 µM; (c) N-trans-feruloyltyramine (7): ● control, ■ (7) 8 µM, ▲ (7) 4 µM ◆ (7) 2 µM. The secondary plot of each compound is on the right.

