
Figure 3.
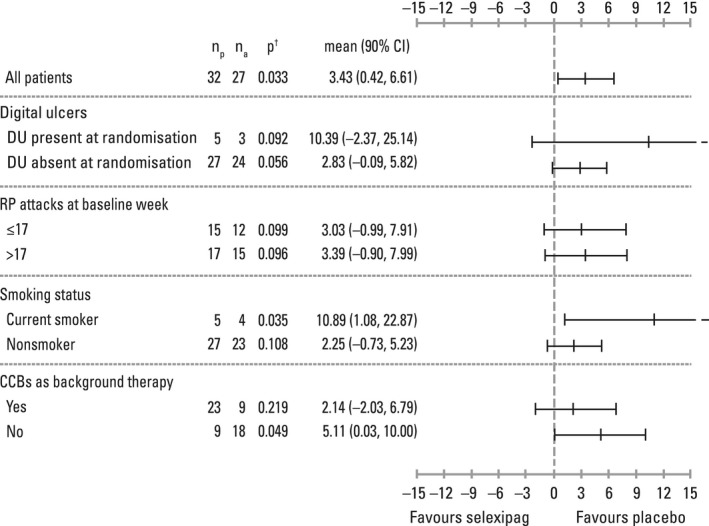
Forest plot of summary statistics of weekly attacks of Raynaud's phenomenon (RP) from posterior distribution of negative binomial Bayesian model (subgroup analyses; per‐protocol set). np = number of patients receiving placebo; na = number of patients receiving active treatment; P† = probability that the difference between the treatment means (selexipag minus placebo) for weekly average number of RP attacks in the maintenance period is <0; 90% CI = 90% confidence interval; DU = digital ulcer; CCBs = calcium‐channel blockers.