
Figure 7.
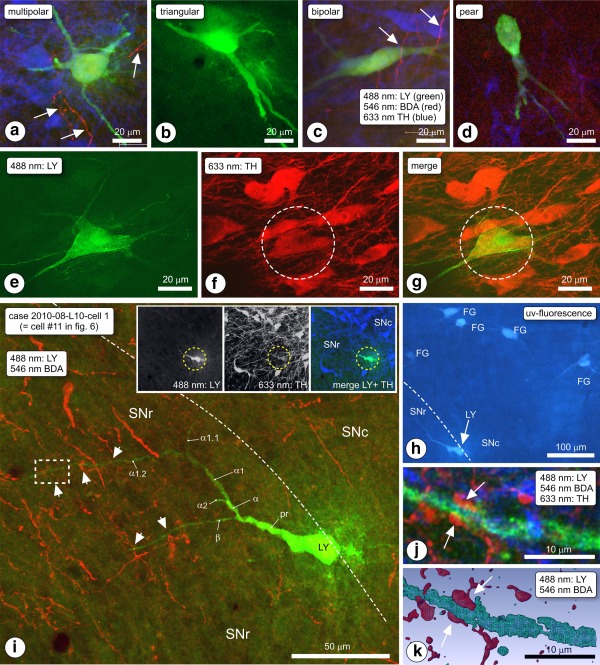
(a–d) Morphological phenotypes of intracellularly Lucifer yellow (LY)‐injected, retrogradely labeled SN/VTA neurons. (a) Multipolar, (b) triangular. (c) Bipolar, (d) pear‐shaped. Arrows indicate biotinylated dextran amine (BDA) labeled fibers (red). (e–g) Expression of tyrosine hydroxylase (TH) in an LY‐injected retrogradely labeled SN neuron, visualized by two‐channel CLSM. (e) LY channel, (f) TH‐channel, (g) merged image. (h–k) Example of a LY‐injected, retrogradely labeled neuron. Rat 2010‐008, slice L10, cell #1. (h) Inspection of the area in a fluorescence microscope revealed a LY injected, FG labeled neuron (LY). (i) In the CLSM, the neuron was scanned first at low magnification such that the spatial relationships between the cell body (LY) and dendrites (green; arrowheads indicate appositions) and the anterogradely labeled striatal fibers (red) became visible in the merge image. The TH‐channel is omitted here because the location of the neuron at the edge between substantia nigra pars compacta (SNc) and substantia nigra pars reticulata (SNr) produced a massive TH–associated signal overwhelming other colors in the merge image (all three channels visible in the inset). The dashed‐line boxed area indicated in panel (i) was Z‐scanned at high magnification, shown here in projection image (j) and in 3D reconstruction (k). Arrows indicate an apposition between boutons of BDA labeled fibers and identified dendrite α1.2, in SNr, approximately 100 μm away from the perikaryon. The appositions form an “earmuff” contact [Color figure can be viewed at http://wileyonlinelibrary.com]