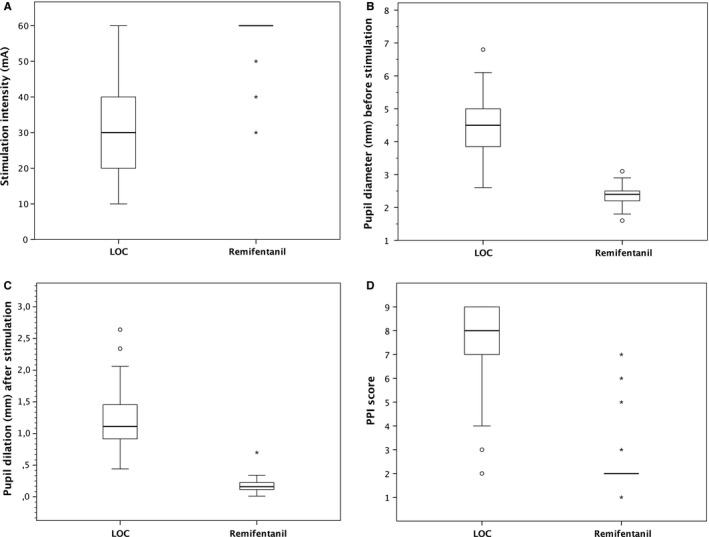
Figure 2.

(A), Boxplots of necessary stimulation intensity to elicit PDR via a PPI stimulation protocol. The thick horizontal line indicates the median, the limits of the box indicate the 25th (Q1) and 75th (Q3) percentiles, and the whiskers denote the extreme values (Q1 − 1.5*[IQR]; Q3 + 1.5*[IQR]). (B), Boxplots of baseline pupil diameter in millimetres (mm) before stimulation. (C), Boxplots of pupil dilation in millimetres (mm) evoked by the standardized noxious stimulation. (D), Boxplots of the pupillary pain index (PPI) score based on stimulation intensity and pupil variation
