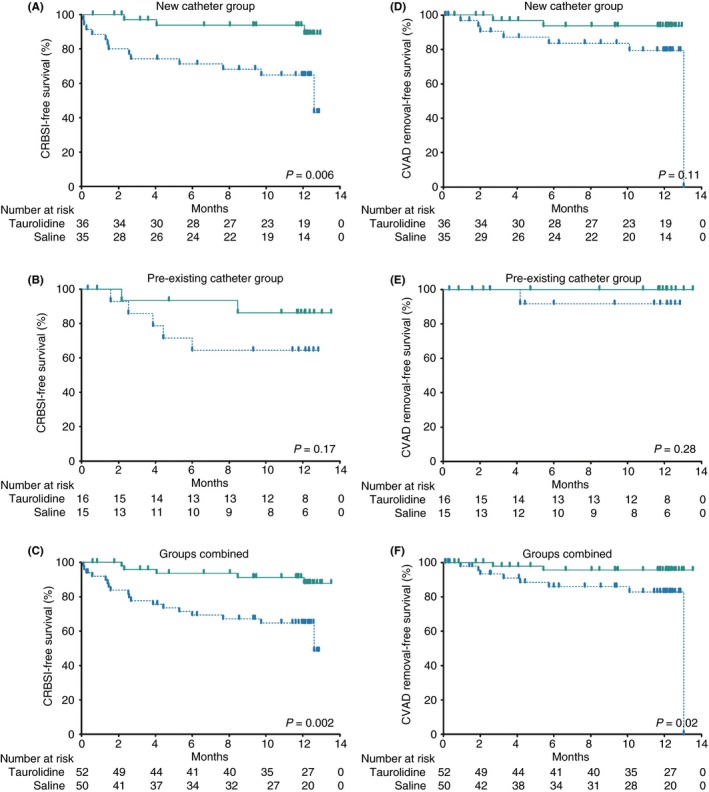
Figure 2.

Kaplan‐Meier survival curves of modified intention‐to‐treat population. CRBSI, catheter‐related bloodstream infection; CVAD, catheter‐related access device. Kaplan‐Meier survival curves presenting the time to CRBSIs (A‐C) and time to CVAD removals due to CRBSIs (D‐F) with CVADs locked with 2% taurolidine (green continuous line) versus 0.9% saline (blue interrupted line) in the new catheter group, pre‐existing catheter group, and the groups combined. Survival curves were compared using log‐rank testing
