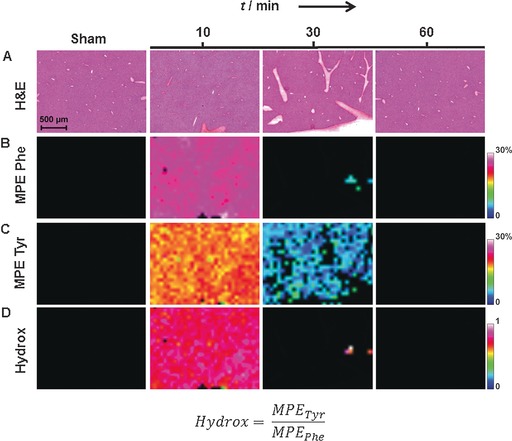
Figure 2.

Detection of localized Phe and Tyr kinetics in liver tissue at three time points at a 150‐μm spatial resolution. Sections taken from mice 10 min after injection with saline (sham) are shown as a control. A) H&E stains; B–D) dynamic MS images for 13C6‐Phe MPE, 13C6‐Tyr MPE, and hepatic hydroxylation (Hydrox), respectively.
