Figure 1.

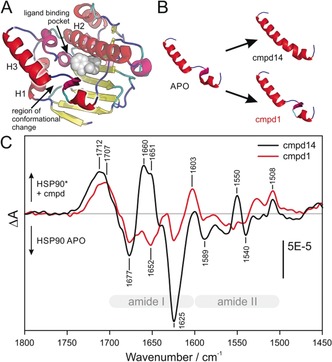
Conformational change in the ATP binding pocket of HSP90 NTD induced by different types of inhibitors. A) The NTD of HSP90 APO (1YER) is shown schematically. The secondary structure assignment was achieved with the STRIDE algorithm22 and the different structures were colored according to the following schema: β‐sheet (yellow), random coil (blue), α‐helices (red), 310‐helix (magenta), and turn (cyan). The position of the ligand binding pocket is illustrated by addition of the loop binder cmpd 1 (gray spheres). B) Only helix 3 of the HSP90 APO structure (1YER) and the cocrystal structures of HSP90 in complex with cmpd 14 (PDB ID 5J27) and cmpd 1 (PDB ID 5J64) are shown. The binding of cmpd 14 leads to a secondary structure change in helix 3, turning the helix‐loop‐helix motif into a continuous helix conformation. In contrast, the binding of cmpd 1 does not significantly change the secondary structure. C) Compound interaction spectra of cmpds 14 and 1 represent the absorbance difference spectra of the immobilized HSP90 with and without the respective compounds and are therefore the sum of the HSP conformational change spectra and the compound absorbance spectra. The frequency of the positive band at 1660–1650 cm−1 in the interaction spectrum with cmpd 14 is characteristic for helix secondary structures and can thereby be assigned to the completed helix 3.
