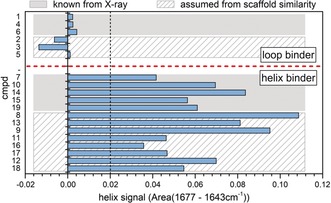
Figure 2.

Identifying the conformational activity of inhibitors by analysis of amide I difference bands. Helix signal area values were extracted from the compound interaction spectra of helix binders by integration of the helix signal region as shown in Figure S6. The compounds are grouped according to secondary structure information known from X‐ray data of cocrystals of HSP90–inhibitor complexes (gray boxes, Figure S4). The agreement of the helix signal area values with the secondary structure information of HSP90–inhibitor complexes clearly validates the approach. By using a cutoff of 0.02, a prediction of the inhibitor type (helix or loop binder) for inhibitors with an unknown binding mode (shaded boxes) can be made without prior knowledge. The scaffold similarities among the compounds (Table 1) indicate that the predictions are correct.
