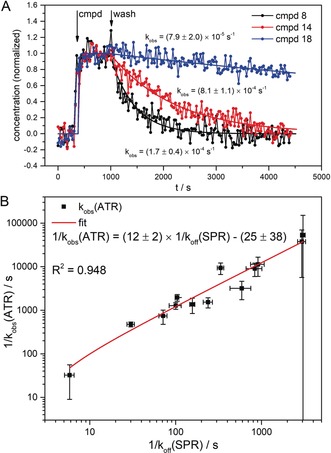
Figure 3.

Kinetics of ensemble conformational change. A) Exemplary concentration profiles of the conformational change spectra of the interaction between HSP90 and three different helix binders (cmpds 8, 14, and 18). The concentration profiles were obtained from MCR‐ALS analysis of the respective time series of infrared difference spectra. After 5 minutes of prewash, the compounds were flushed over the surface for 10 minutes at a concentration of 5 μm followed by a washing step of 60 minutes. The smooth lines represent the three‐segmented fit of the concentration profiles (see the experimental procedures). The observed decay rates k obs(ATR) were obtained from monoexponential fits of the wash segments B) Concentration profiles of 13 helix binder compounds were analyzed as described above and the obtained average k obs(ATR) values plotted in reciprocal values against the reference k off values from SPR experiments. With a correlation coefficient R 2 of 0.948, the ATR‐derived residence times strongly correlate with the SPR reference values. The 1/k obs(ATR) values are 12 times lower than the 1/k off(SPR) values, which most likely comes from mass‐transport limitation caused by the large surface area and high protein loading in the ATR experiment.
