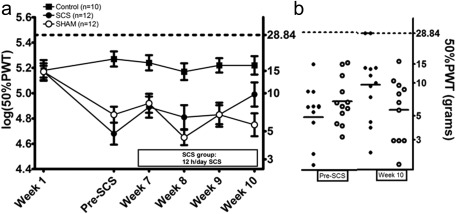
Figure 6.

Effect of long‐term SCS (12 hours/day from Week 7 to Week 10) on paw withdrawal thresholds (50% PWT(grams) and log(50%PWT)) as assessed with von Frey filaments. Mean ± SEM (a). Scatterplot of PWTs in the SCS and Sham group before long‐term SCS and in Week 10. The horizontal lines mark the averages in each group (b). * p < 0.05 regression analysis.
