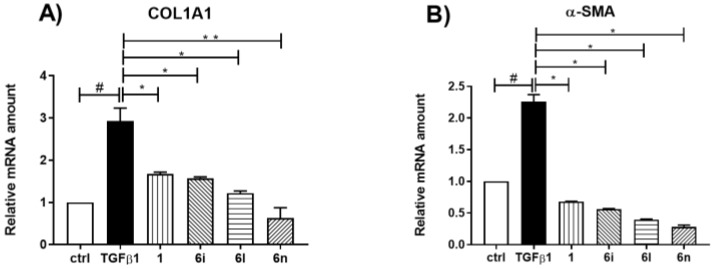
Figure 2.
Effects of compounds 6i, 6l and 6n inhibiting (A) COL1A1, (B) α-SMA mRNA levels in LX-2 cells. Data were analyzed by Real-time PCR and presented as the mean ± SEM, (#) p < 0.05 as compared to that of control group; (*) p < 0.05, (**) p < 0.01 as compared to that of TGF-β1 group. The mRNA expression levels were normalized against GAPDH.

