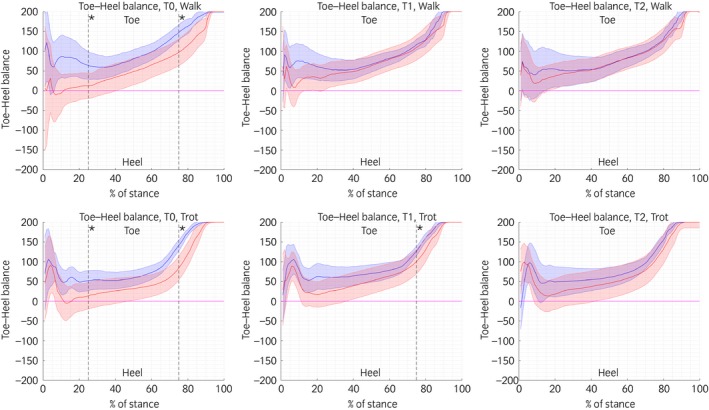
Figure 2.

Schematic representation of the median toe–heel balance curves at the walk and trot: in blue the median ± median absolute deviation (mad) of the normal ponies, and in red the median ± mad of the obese ponies. * = Significant difference P<0.017 after Bonferonni correction compared with the normal group. An index of 0 indicates perfect balance in vertical ground reaction forces between the two regions, whereas positive and negative values indicate relatively higher loading of the toe and heel region, respectively.
