
Figure 3.
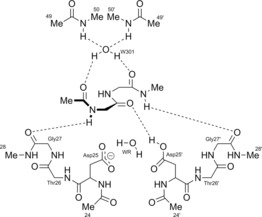
A schematic representation of the 133‐atom system obtained after truncating the HIV‐1 Protease 4HVP (Figure 2), which contains the active site studied. The system shown here corresponds to red‐encircled region in Figure 2 and the bottom part of the green‐encircled region. Hence, the residues 49, 49(′), 50 and 50(′) are representations of the flaps (green circle in Figure 2) while the rest represent the active site (red circle in Figure 2).