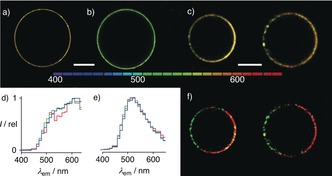
Figure 4.

Representative hyperspectral TPEFM images (λ ex=720 nm) of GUVs composed of a) Ld DOPC, b) Lo SM/CL 7:3, and c) SM/DOPC/CL 58:25:17 (two different GUVs) in the presence of papillon 2 (color bar: emission wavelengths in the 400–650 nm range), with normalized emission spectra of entire GUVs composed of d) DOPC and e) SM/CL 7:3 with 0.5 μm (red), 1.0 μm (green), and 2.0 μm (blue) 2, and f) spectrally unmixed images of GUVs in (c) using reference spectra in (d) and (e) showing Ld (red) and Lo domains (green). Scale bar: 20 μm.
