
Figure 3.
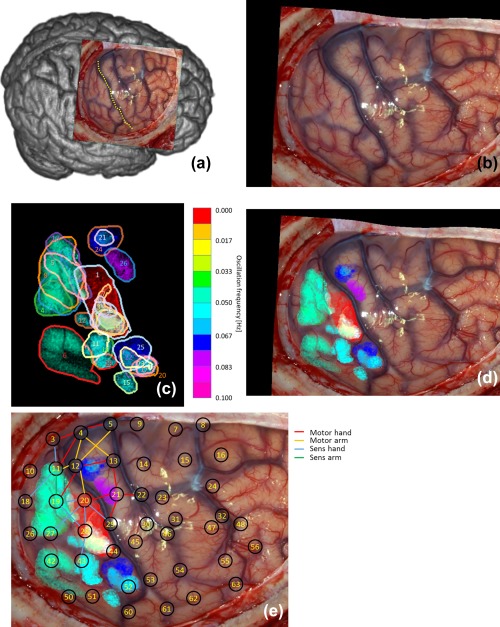
(a) Overview of observed brain and central sulcus as yellow dotted line of patient 1. (b) Photo of exposed brain. (c) Found 25 regions with SSHOs. Each color corresponds to a different SSHO frequency. (d) Regions overlain over original photo. (e) Locations intra‐cortical EEG grid electrode overlain over (d). The red area corresponds to the repetitive epileptic attack [Color figure can be viewed at http://wileyonlinelibrary.com]