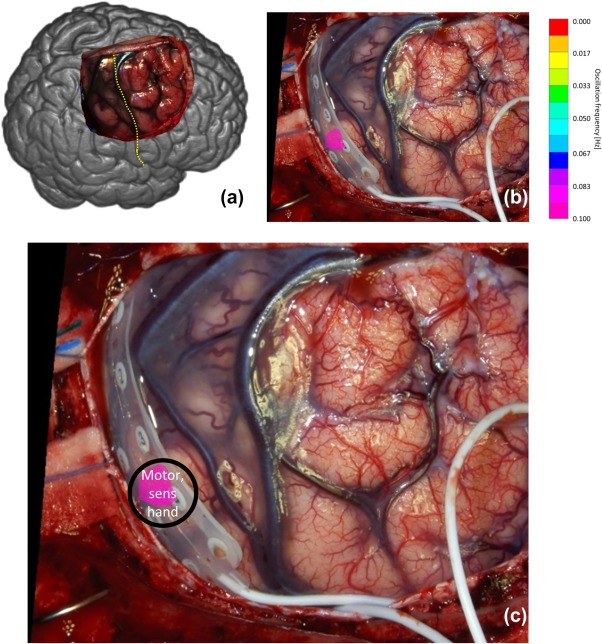
Figure 5.

(a) Overview of observed brain and central sulcus as yellow dotted line of patient 2. (b) Photo of exposed brain. (c) SSHO region overlain of photo with intra‐cortical grid. Patient 2 only showed one oscillating area. Note that during multi‐spectral capturing the EEG grid was not present on the brain tissue [Color figure can be viewed at http://wileyonlinelibrary.com]
