
Figure 7.
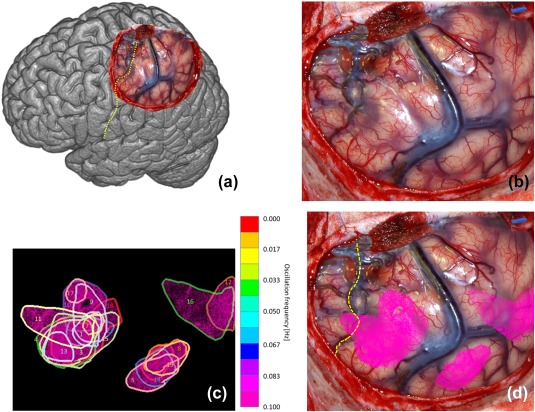
(a) Overview of observed brain and central sulcus as yellow dotted line of patient 4. (b) Photo of exposed brain. (c) Found 19 regions with SSHOs. Each color corresponds to a different SSHO frequency. (d) Regions overlain over original photo [Color figure can be viewed at http://wileyonlinelibrary.com]