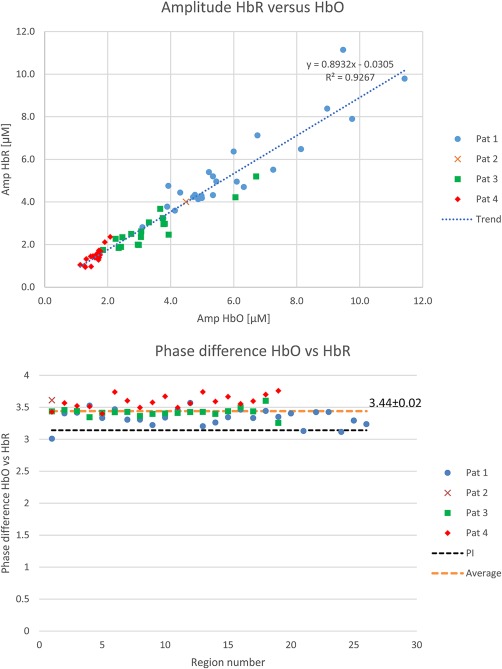
Figure 8.

Top: Relation between HbR and HbO amplitude for all SSHOs (including trend based on linear regression). It demonstrates that the HbR amplitude is about 90% of the HbO amplitude. Bottom: phase difference between HbR and HbO oscillation. It appears that the HbR oscillation lags slightly more than π behind the HbO oscillation [Color figure can be viewed at http://wileyonlinelibrary.com]
