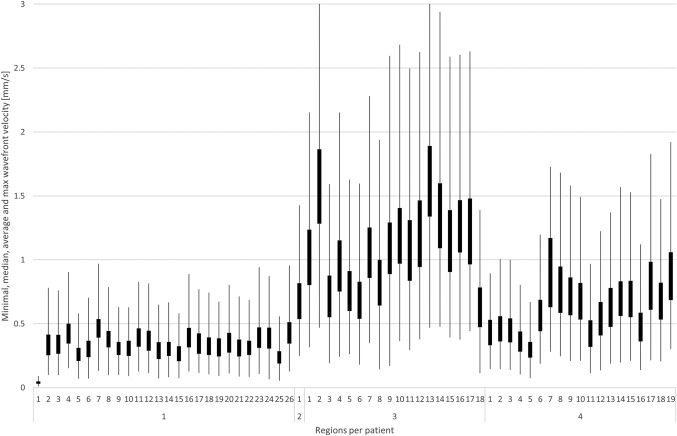
Figure 9.

Wavefront velocity statistics for each SSHO based on phase images. For each region, the minimum velocity is given by the lowest point of the lowest line, the median velocity by the box bottom, the average velocity by the box top and the maximum velocity by the highest point of the highest line (clipped to zoom in on average and median velocity). Note that the wavefront velocity of patient 1 was almost a factor 2 lower than for the other patients
