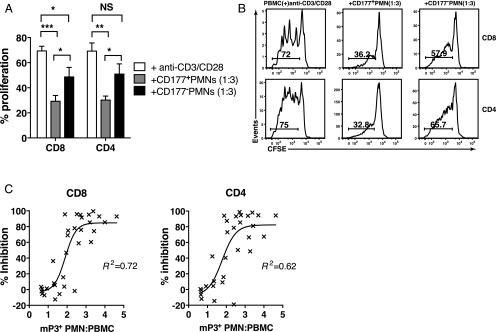
FIGURE 5.
mP3+ PMN mediate the inhibition of T cell proliferation. CFSE-labeled PBMC were activated with anti-CD3/CD28 mAbs in all cell cultures. Sort-purified PMN were fixed with 0.5% PFA. (A) Sorted CD177-expressing and CD177-negative PMN were cocultured with PBMC at a ratio of 3:1. T cells alone were used as control. Data from three different donors (n = 3) are shown as mean ± SEM. ***p < 0.001, **p < 0.003, *p < 0.05, p = NS. (B) Representative histogram plots of three different donors are shown. Numbers on histograms represent the percentage of proliferating T cells. (C) Nonlinear regression analysis with results from seven different donors (n = 7) shows the correlation between percentage inhibition and the relative mP3-expressing PMN/PBMC ratio. R2 = 0.72 for CD8 and R2 = 0.62 for CD4, respectively.

