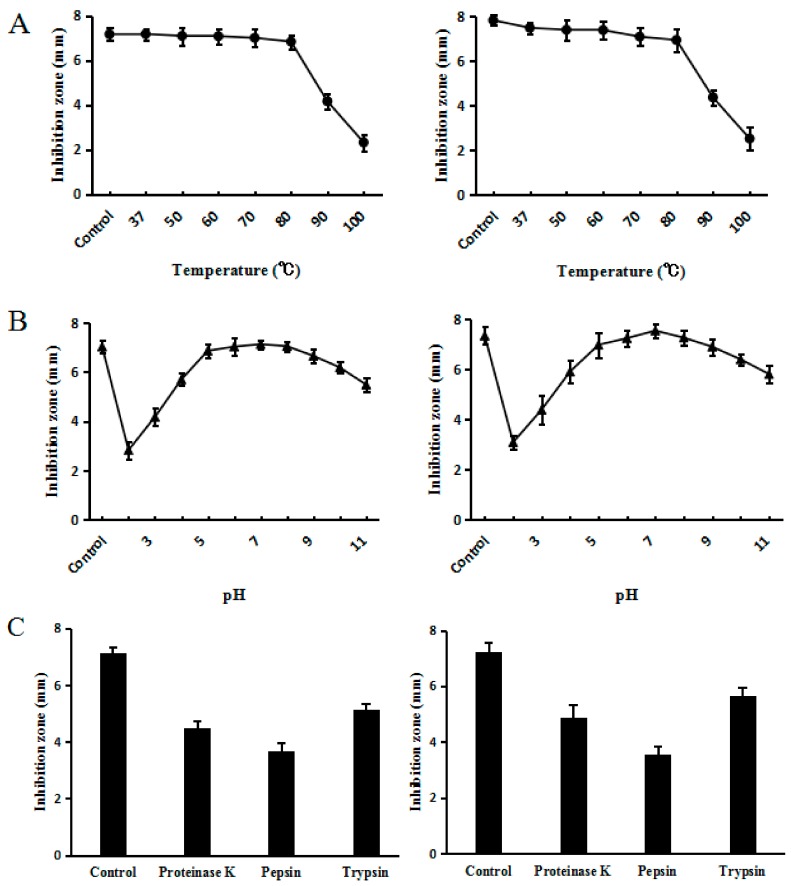
Figure 7.
Effects of temperature (A), pH (B), and proteases (C) on recombinant (left) and synthesized C–L (right). (A) The peptide sample kept at 4 °C was used as a control. (B) The sample kept in the original culture (pH 6.0) was used as a control. (C) The original sample without any enzymatic treatment was used as a control. The graphs were derived from average values for three replicate experiments and error bars show standard deviations. E. coli ATCC25923 was used as the indicator strain.

