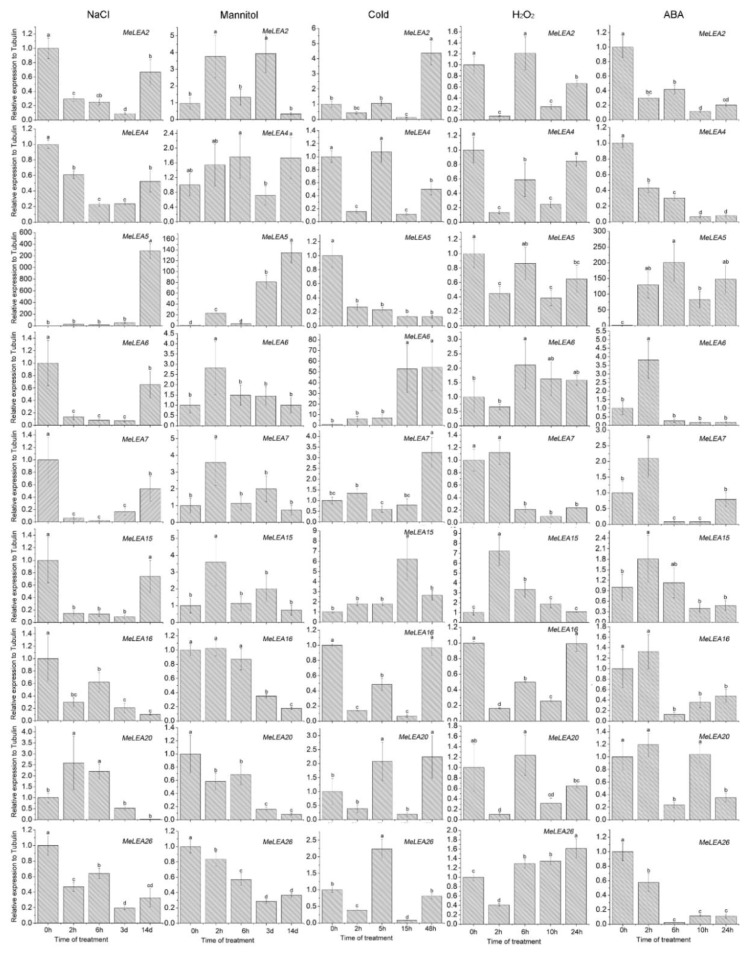
Figure 7.
Expression profiles of the MeLEAs in leaves under salt, osmotic, cold, H2O2, and ABA treatments. NTC (no treatment control) was normalized as “1”. Data are means ± SD of n = 3 biological replicates. Means denoted by the same letter do not significantly differ at p < 0.05 as determined by Duncan’s multiple range test.

