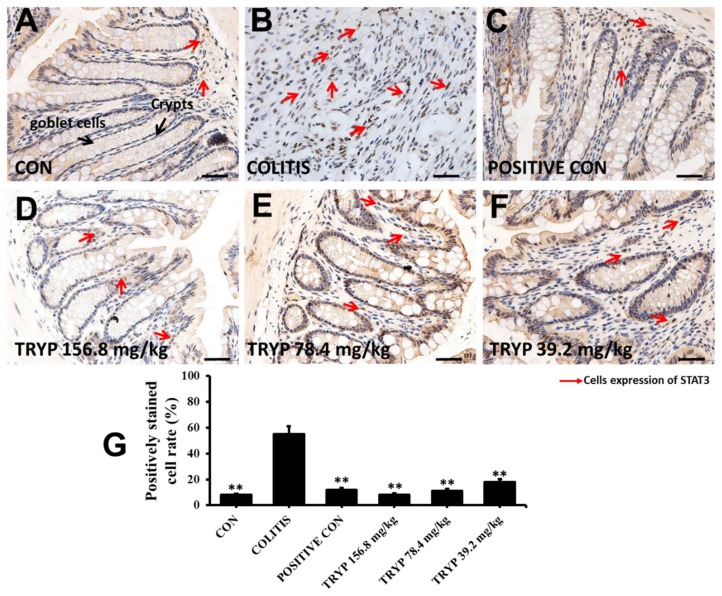
Figure 6.
Treatment with TRYP suppressed the expression of p-STAT3, magnification ×400. (A) Immunohistochemistry result of control group with expressing p-STAT3 only. (B) The expression level of p-STAT3 increased sharply and both crypts and goblet cells disappeared. (C) Immunohistochemistry result of sulfasalazine control. (D–F) The expression level of p-STAT3 with different concentrations of TRYP treatment. (G) The column heights represented the positively stained cell rates. Error bars represented means ± SEM of n = 3, ** p < 0.01 compared with colitis.

