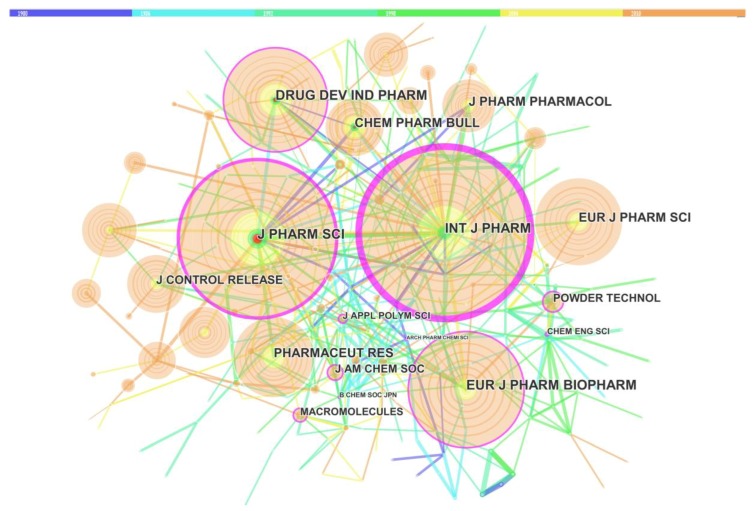
Figure 8.
Map of the journal co-citation network. Different colors represent different time slices, deep blue:1980 to1985, sky blue: 1986 to 1991, pink green: 1992 to 1997, green: 1998 to 2003, yellow: 2004 to 2009 and orange: 2010 to 2015. Each circle represents for one journal. The size of circles was proportional to the citation number. The purple ring of the circles indicates the core journals.

