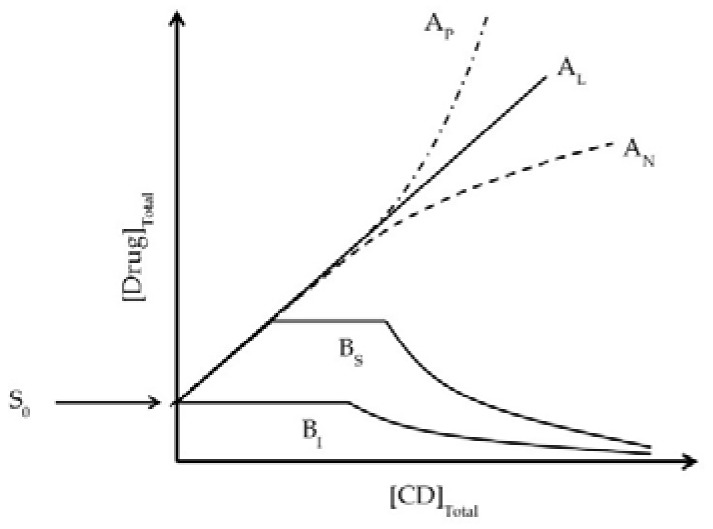
Figure 2.
Types of phase-solubility diagrams according to Higuchi and Connors [11] showing how the total drug solubility changes with increasing CD concentration. A-type diagrams are formed when the drug/CD complex is soluble in the aqueous complexation media and they are usually associated with the water-soluble CD derivatives. B-type diagrams are observed when the complex has limited solubility in the media and these are usually associated with the natural CDs that have limited solubility in aqueous media. AL: linear diagram; AP: positive deviation from linearity; AN: negative deviation from linearity; BS: the complex has some but limited solubility; BI: the complex is insoluble.

