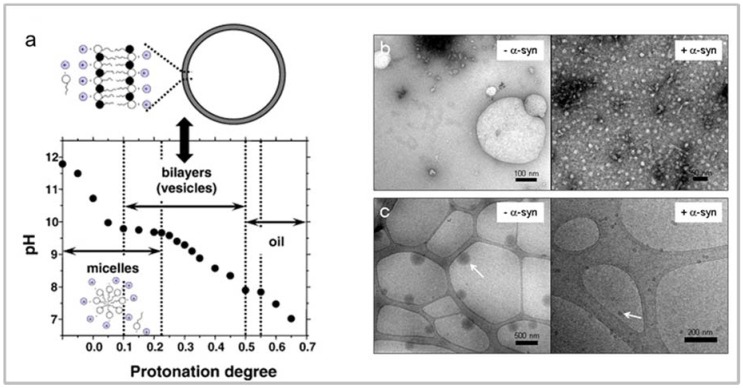
Figure 3.
Biophysical properties of PUFAs. Titration curve for oleic acid/sodium oleate. (a) The plot indicates the regions for the formation of micelles, vesicles and oil droplets as a function of pH; Negative staining (b) and cryo (c) electron microscopy images of samples of DHA in the absence (− α-syn) and in the presence (+α-syn) of the protein. The arrows indicate the oil droplets. Taken, with permission, from [113,120].

