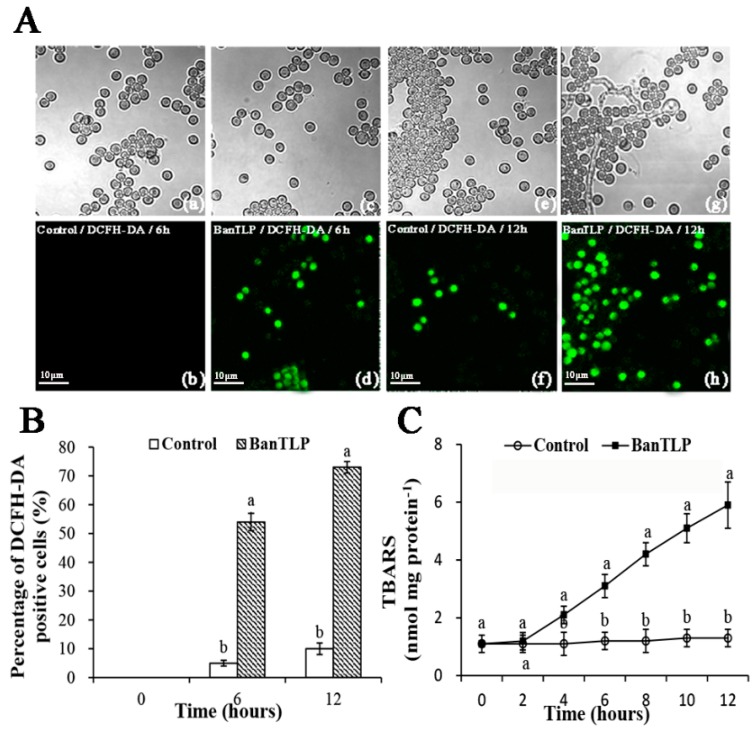
Figure 4.
Effects of BanTLP at 60 μM on oxidative stress of P. expansum. Figures panels show images of (A) the generation of intracellular reactive oxygen species (ROS), (B) the percentage of 2′,7′-dichlorofluorescein diacetate (DCFH-DA) positive cells, and (C) thiobarbituric acid-reactive species (TBARS) contents. The DCFH-DA fluorescent probe was visualized with the aid of fluorescence microscopy in P. expansum conidia treated with distilled water for 6 h (a,b) and 12 h (e,f) or treated with BanTLP for 6 h (c,d) and 12 h (g,h). Upper panels display the bright field images, while lower panels display the corresponding fluorescence images for the same field. The scale bar represents 10 μm. Each value is mean of three replicates for two independent experiments. Vertical bars represent standard deviations of means. Those data marked with different letters are significantly different (p < 0.05) between control and treatment groups at the same time according to Duncan’s multiple range test.

