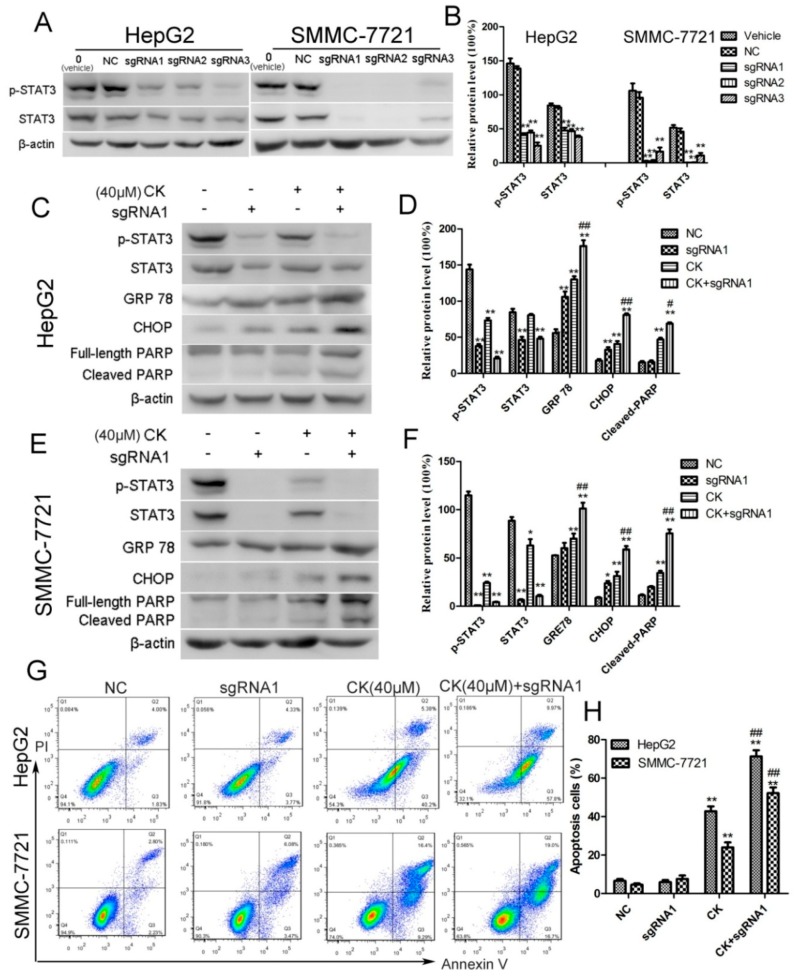
Figure 5.
Silencing STAT3 enhanced ERS and apoptosis in HepG2 and SMMC-7721 cells. (A) STAT3 was knocked out using CRISPR/Cas9 technology. Western blot analysis for p-STAT3 and STAT3. (B) Quantification of the western blot data from (A) normalized to β-actin. Data are presented as mean ± SD; Statistics were done by one-way ANOVA and Dunnett text. * p < 0.05, ** p < 0.01 vs. Vehicle. (C) HepG2 or STAT3-sgRNA1-transfected cells were treated with CK. Western blot analysis for p-STAT3, STAT3, GRP78, CHOP, and PARP. (D) Quantification of the western blot data in (C) normalized to β-actin. Data are presented as mean ± SD; Statistics were done by one-way ANOVA and Dunnett text. * p < 0.05, ** p < 0.01 vs. NC; # p < 0.05, ## p < 0.01 vs. CK. (E) SMMC-7721 or STAT3-sgRNA1-transfected cells were treated with CK. Western blot analysis for p-STAT3, STAT3, GRP78, CHOP, and PARP. (F) Quantification of the western blot data in (E) normalized to β-actin. Data are presented as mean ± SD; Statistics were done by one-way ANOVA and Dunnett text. * p < 0.05, ** p < 0.01 vs. NC; # p < 0.05, ## p < 0.01 vs. CK. (G) Apoptotic cells were assessed by flow cytometry following Annexin V/PI staining. (H) Quantitative analysis of the percent of apoptosis cells using the flow cytometry data from (G). Results are shown as mean ± SD; Statistics were done by one-way ANOVA and Dunnett text. * p < 0.05, ** p < 0.01 vs. NC; # p < 0.05, ## p < 0.01 vs. CK.

