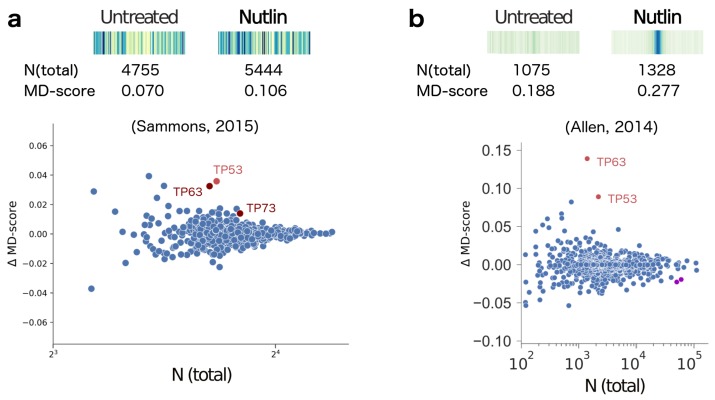
Figure 1.
(a) Top: The motif displacement distribution as heatmap (increasingly dark blue indicates more instances of motif), MD-score and the number of motifs within 1.5 kb of an ATAC-seq peak before and after stimulation with Nutlin-3a (e.g., Nutlin) [61] for TP53, the transcription factor known to be activated. Bottom: For all motif models (each dot), the change in MD-score following perturbation (y-axis) relative to the number of motifs within 1.5 kb of any ATAC-seq peak center (x-axis). Red/maroon points indicate significantly increased MD-scores (p-value , , respectively). (b) Similar analysis obtained from nascent transcription data [55], where MD-scores are measured relative to eRNA origins. Purple dots indicate significantly decreased MD-scores. Figure adapted from Azofeifa et al. [58].

