Figure 5.
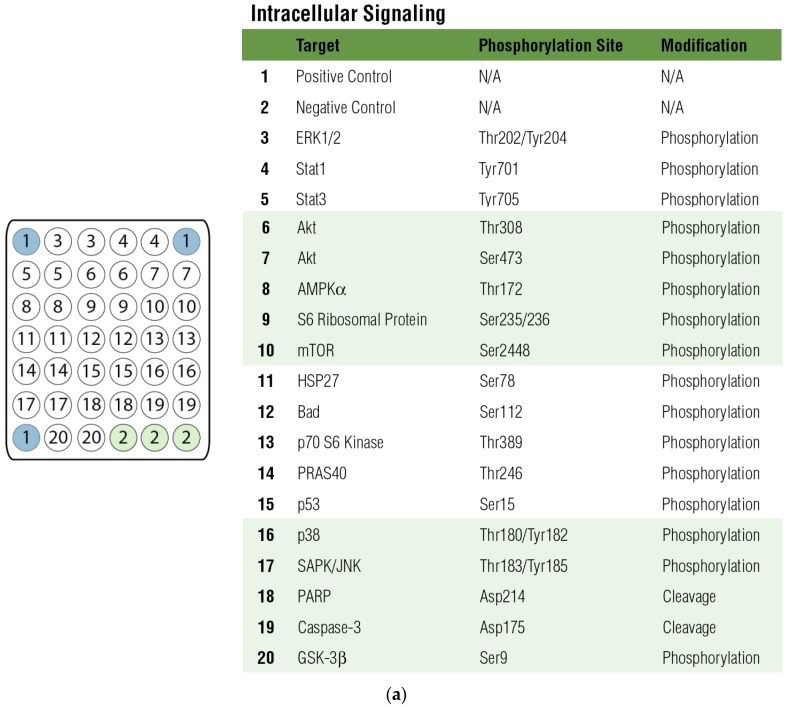
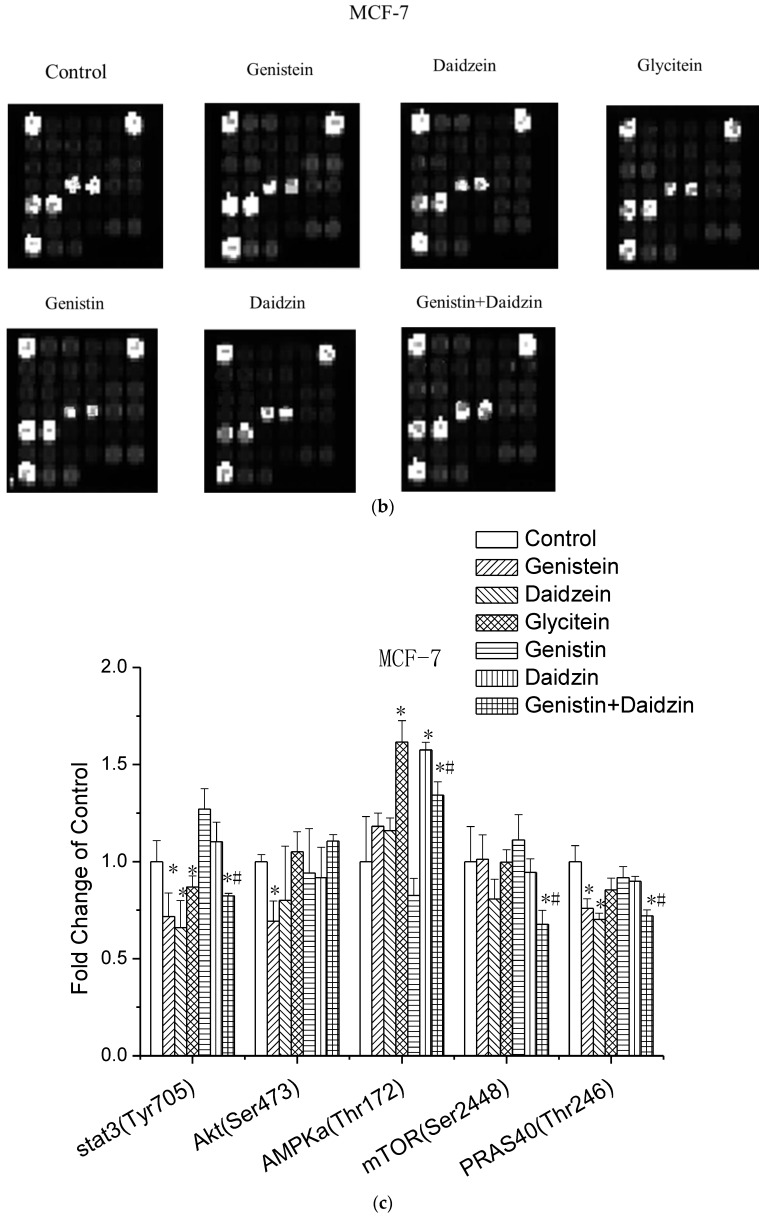
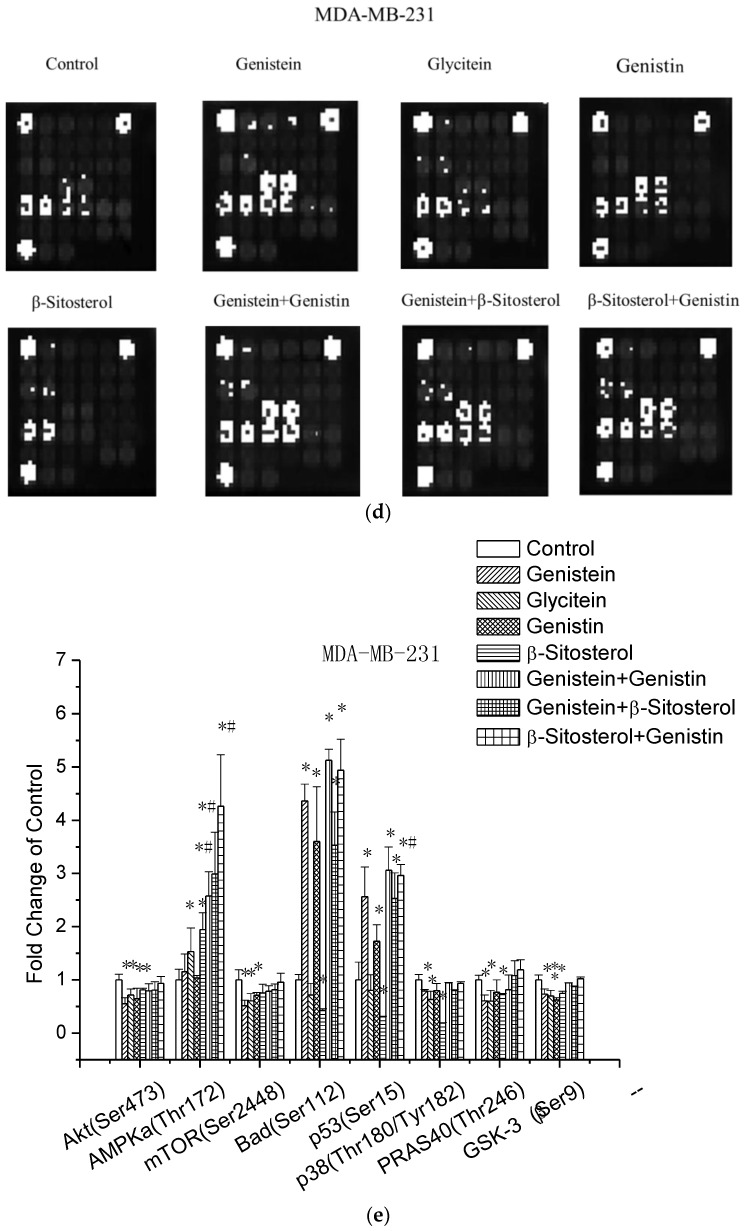
Modulations of intracellular signaling pathways. Cells were treated with samples, or control for 72 h. Total protein was extracted for the analysis. A slide-based antibody array was used for simultaneous detection of 18 signaling molecules (a) when phosphorylated or cleaved using a PathScan Intracellular Signaling Array kit. Image (b) and quantitative data (c) for MCF-7 cells as well as image (d) and quantitative (e) data for MDA-MB-23 cells were obtained using a LiCor Odyssey imaging system. Data are presented as mean ± SD. * indicates a significant difference compared to the control (p < 0.05). # indicates a significant difference compared to treatment with samples by single (p < 0.05).


